Medicaid NEMT Rates by State: Complete 2026 Reimbursement Guide
Table of Contents
The wheelchair trip that pays $100 in New York might only pay $35 in Alabama. That’s not a typo—it’s the reality of Medicaid NEMT rates by state, where reimbursement can vary by more than 300% for identical services depending on where you operate.
This disparity creates winners and losers in the $10-12 billion non-emergency medical transportation industry. Providers who understand state-by-state rate variations make strategic decisions about where to operate, which payers to prioritize, and how to structure their service mix for maximum profitability. Those who don’t often discover—too late—that their business model doesn’t work in their chosen market.
Under federal regulation 42 CFR § 431.53, every state Medicaid program must provide transportation to covered medical services. But while the federal government mandates coverage, states control how much they pay. The result is a patchwork of fee schedules, broker contracts, and reimbursement methodologies that confounds even experienced NEMT operators.
This guide provides current Medicaid NEMT reimbursement rates for all 50 states plus the District of Columbia—the most comprehensive state-by-state rate directory available. Whether you’re evaluating expansion into new markets, negotiating broker contracts, or benchmarking your current reimbursement against industry standards, you’ll find the data you need to make informed decisions.
How Much Does Medicaid Pay for NEMT? National Overview
Medicaid NEMT reimbursement varies dramatically, but national benchmarks for 2025-2026 provide useful reference points for understanding where your state falls on the spectrum.
Average NEMT Reimbursement Rates Nationwide
| Service Level | Low Range | National Average | High Range |
|---|---|---|---|
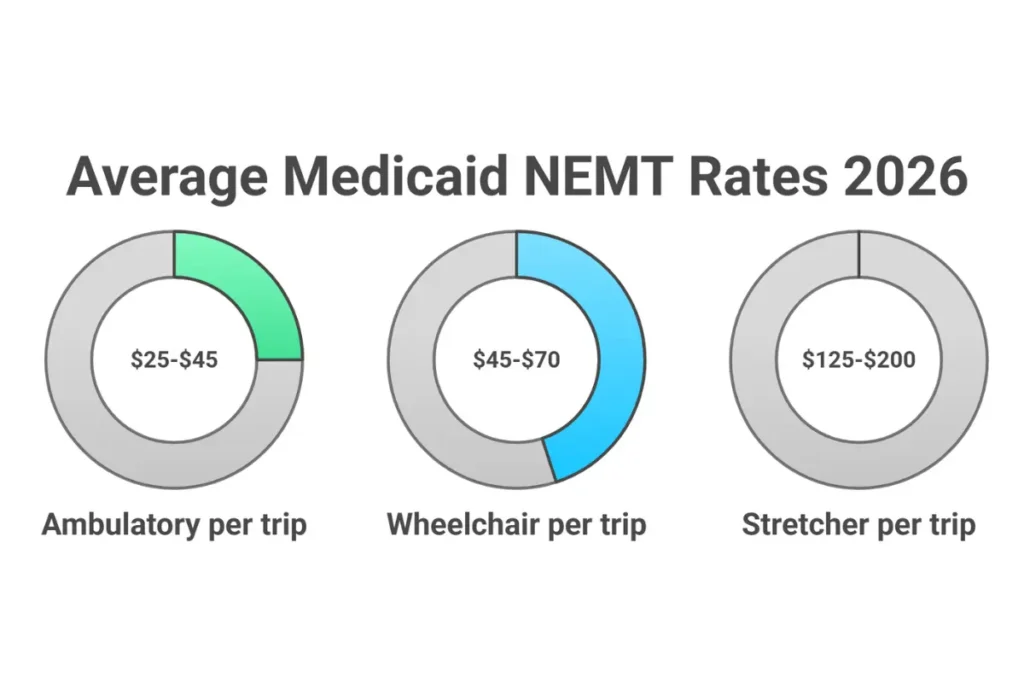
| Ambulatory (per trip) | $12-$25 | $25-$45 | $50-$75 |
| Ambulatory (per mile) | $1.10-$2.00 | $2.50-$3.50 | $4.00-$7.00 |
| Wheelchair (per trip) | $25-$45 | $45-$70 | $80-$120 |
| Wheelchair (per mile) | $2.00-$3.00 | $3.50-$5.00 | $5.00-$10.00 |
| Stretcher (per trip) | $75-$125 | $125-$200 | $200-$300+ |
| Stretcher (per mile) | $3.50-$5.00 | $5.00-$7.00 | $8.00-$10.00+ |
Note: Rates represent 2025-2026 estimates based on state fee schedules and broker contracts. Actual reimbursement varies by state, payer, and contract terms.
The Centers for Medicare & Medicaid Services (CMS) does not publish national average NEMT rates—each state sets its own reimbursement through fee schedules or broker negotiations, as outlined in the Medicaid Transportation Benefit regulations (42 CFR § 431.53) available on the official Electronic Code of Federal Regulations website. This creates the wide variance you see in the table above.
Non-Emergency Medical Transport Cost Per Mile
Medicaid NEMT mileage rates typically range from $0.70 to $10.00 per loaded mile, with most states falling between $2.50 and $5.00 for standard services. The key word is “loaded”—Medicaid only reimburses miles traveled with a patient in the vehicle, not deadhead miles driving to pickups or returning to base.
Wheelchair and stretcher transport command higher per-mile rates due to specialized equipment, additional staffing requirements, and longer loading/unloading times. In broker-managed urban markets, specialized transport can reach $8-$10 per mile—while rural fee-for-service states may pay as little as $0.70 per mile for basic ambulatory service.
Does Medicaid Pay Hourly for NEMT?
Hourly NEMT rates are uncommon in Medicaid billing. Most states use base trip fees plus mileage, with optional wait-time add-ons billed in 15-60 minute increments for extended facility delays. When wait-time charges apply, typical reimbursement equals $25-$60 per hour.
Some providers quote hourly equivalents for planning purposes:
- Ambulatory: ~$25/hour equivalent
- Wheelchair: ~$45/hour equivalent
- Stretcher: ~$100/hour equivalent
However, these figures represent blended estimates rather than actual hourly billing structures. For detailed billing methodology, see our complete NEMT billing guide.
Why Understanding State Rates Matters
The financial impact of state rate differences compounds quickly at scale. Consider two identical 10-vehicle fleets—one operating in New York, the other in Mississippi:
| Metric | New York Fleet | Mississippi Fleet |
|---|---|---|
| Avg. rate per trip | $85 | $35 |
| Trips per day | 50 | 50 |
| Annual revenue | ~$1.1M | ~$455K |
| Difference | +$645,000/year | — |
Same vehicles. Same trip volume. More than double the revenue—simply because of state rate differences.
This reality drives strategic decisions about market selection, payer mix optimization, and whether expansion into adjacent states makes financial sense. Providers in low-rate states often diversify into Medicare Advantage and private pay to improve margins, while those in high-rate states focus on Medicaid volume.
Why NEMT Rates Differ So Dramatically Between States?
The 300%+ rate variation between states isn’t random—it reflects fundamental differences in how states fund, structure, and administer their Medicaid transportation programs. Understanding these factors helps providers identify favorable markets and negotiate more effectively within their current state.
State Medicaid Budgets and Federal Matching (FMAP)
The Federal Medical Assistance Percentage (FMAP) determines how much the federal government contributes to each state’s Medicaid costs. FMAP rates range from 50% to over 77% based on state per-capita income—meaning wealthier states receive less federal support and must fund more from state budgets.
States with higher FMAP rates (poorer states) receive more federal dollars per Medicaid dollar spent, theoretically enabling higher provider rates. In practice, however, many high-FMAP states also face tighter overall budgets, resulting in lower reimbursement despite federal support. The relationship between FMAP and provider rates is complex—budget priorities and political decisions often matter more than federal matching formulas.
26 states increased NEMT rates in FY2024 due to inflation and provider shortages, with 20+ states proposing additional increases for FY2025-2026. Meanwhile, some states like North Carolina implemented rate cuts of 3-10% before partial reversals under managed care pressure.
Cost of Living Adjustments by Region
Geographic cost differences create natural rate tiers across the country:
| Region | Typical Rate Tier | Examples |
|---|---|---|
| Northeast | High | NY, NJ, MA, CT |
| West Coast | High | CA, WA |
| Midwest | Low-Medium | ND, WI, NE, OH |
| Southeast | Low-Medium | AL, MS, GA, NC |
| Mountain/Rural | Low | WY, MT, WV |
High cost-of-living states must pay more to attract and retain drivers, cover higher insurance costs, and offset elevated fuel and vehicle expenses. These operational realities translate into higher Medicaid rates—providers in New York or California simply cannot operate at Alabama rates.
Urban vs. Rural Rate Considerations
Many states implement tiered rates based on geography:
- Urban areas often receive higher per-trip rates reflecting traffic, parking, and shorter distances
- Rural areas may receive higher per-mile rates compensating for longer travel distances
- Some states (Texas, California) maintain distinct metro vs. rural rate schedules
Rural providers face unique challenges including longer deadhead miles, fewer trips per day, and limited volume—factors that higher mileage rates only partially offset.
Broker Model vs. Fee-for-Service Impact
How states structure their NEMT programs fundamentally affects provider reimbursement:
Fee-for-Service (FFS) States:
- Rates published in state fee schedules
- Generally higher per-unit reimbursement
- More administrative burden for providers
- Examples: Minnesota, North Dakota, Alaska
Broker-Managed States:
- Rates negotiated between brokers (ModivCare, MTM, Veyo) and providers
- Typically 10-30% lower than direct Medicaid rates
- Brokers retain margins from capitated state payments
- Faster payment cycles (Net 15-30 vs. 30-90 days)
- Examples: Arizona, Georgia, most large states
Managed Care Organization (MCO) States:
- NEMT embedded within broader MCO contracts
- Rates delegated to individual MCOs
- Multiple rate schedules within same state
- Examples: Ohio (7 MCOs), Texas (multiple STAR plans)
The trend continues toward broker and managed care models—over 40 states now use some form of brokered NEMT arrangement. While this reduces per-trip reimbursement, it often provides volume stability and administrative simplification that smaller providers value.
Types of NEMT Rate Structures
States employ various rate methodologies that affect how providers earn revenue:
| Structure | How It Works | Best For | States Using |
|---|---|---|---|
| Per-Trip Flat Rate | Fixed fee regardless of distance | Short urban trips | Many broker states |
| Base + Mileage | Base fee plus per-mile add-on | Mixed distances | CA, NY, TX, most states |
| Zone-Based | Tiered rates by distance zones | Defined service areas | AZ, CO, some counties |
| Capitated (PMPM) | Per-member monthly payments | Brokers only | Broker contracts |
| Hourly | Time-based billing | Extended waits only | Limited use |
Most states use base plus mileage structures, though the split between base and mileage varies significantly. Some states emphasize higher base rates with lower mileage, while others flip this ratio—affecting which trip types prove most profitable.
Can You Negotiate Higher Rates?
With direct Medicaid (FFS states): Generally no. Rates are set by state fee schedules and apply uniformly to all enrolled providers.
With brokers and MCOs: Yes—but leverage matters. Providers can negotiate rate improvements by demonstrating:
- High trip volumes (500-2,000+ trips/quarter)
- Strong performance metrics (98%+ on-time, <2% no-show)
- Network adequacy value (sole stretcher provider in ZIP code)
- Specialty capabilities (bariatric, pediatric, behavioral health)
Typical negotiated increases range from 10-25% above standard broker rates for high-performing, high-volume providers. Contract renewal periods offer the best negotiation opportunities—begin discussions 6 months before expiration.
State-by-State NEMT Rate Directory: A-M
The following directory provides current Medicaid NEMT reimbursement data for states Alabama through Montana. Each entry includes program type, broker information (where applicable), rate ranges by service level, timely filing requirements, and key billing considerations.
Important Notes:
- Rates represent 2025-2026 estimates based on state fee schedules and broker contracts
- Broker-contracted rates are negotiated and may vary by provider
- Always verify current rates with your state Medicaid agency or broker before bidding contracts
- “Timely filing” indicates the deadline for claim submission after service date
Alabama NEMT Billing Rates
Program Type: Broker-based Medicaid Program: Alabama Medicaid (NET Program) Broker: ModivCare
| Service Level | Rate Range |
|---|---|
| Ambulatory (per trip) | $25-$40 |
| Ambulatory (per mile) | $1.00-$3.00 |
| Wheelchair (per trip) | $45-$70 |
| Wheelchair (per mile) | $2.00-$5.00 |
| Stretcher (per trip) | $100+ |
Timely Filing: 6 months Key Requirements: Broker authorization required, county coordination for rural areas, loaded miles only
Alaska NEMT Billing Rates
Program Type: Fee-for-Service (State Operated) Medicaid Program: Alaska Medicaid Broker: None (direct state billing)
| Service Level | Rate Range |
|---|---|
| Ambulatory (per trip) | ~$50 |
| Ambulatory (per mile) | $4.00-$8.00 |
| Wheelchair (per trip) | ~$90 |
| Stretcher (per trip) | $200+ |
Timely Filing: 12 months Key Requirements: Loaded miles only, PCS required for premium transport levels, weather exception provisions for remote areas, air transport covered for isolated communities
Alaska’s rates reflect the state’s unique geography and high operating costs. Rural and remote area transport commands premium reimbursement unavailable in most lower-48 states.
Arizona NEMT Billing Rates (AHCCCS)
Program Type: Managed Care / Broker Medicaid Program: AHCCCS (Arizona Health Care Cost Containment System) Broker: Veyo (primary), MTM
| Service Level | Rate Range |
|---|---|
| Ambulatory (per trip) | ~$30 |
| Ambulatory (per mile) | $2.00-$7.00 |
| Wheelchair (per trip) | ~$60 |
| Stretcher (per trip) | ~$150 |
Timely Filing: 6 months Key Requirements: GPS-verified loaded miles mandatory, broker portal authorization, AHCCCS-specific billing codes
Arizona operates one of the more mature broker-managed NEMT programs. Veyo’s technology-forward approach emphasizes GPS verification and real-time trip tracking.
Arkansas NEMT Billing Rates
Program Type: Broker-based Medicaid Program: Arkansas Medicaid Broker: MTM / Verida
| Service Level | Rate Range |
|---|---|
| Ambulatory (per trip) | ~$28 |
| Ambulatory (per mile) | $1.50-$6.00 |
| Wheelchair (per trip) | ~$55 |
| Stretcher (per trip) | ~$120 |
Timely Filing: 9 months Key Requirements: Prior authorization required, rural zone add-ons available for long-distance transport
California NEMT Billing Rates (Medi-Cal)
Program Type: Managed Care (Mixed county system) Medicaid Program: Medi-Cal Broker: ModivCare, MTM, regional MCP vendors (varies by county)
| Service Level | Rate Range |
|---|---|
| Ambulatory (per trip) | $40-$60 |
| Ambulatory (per mile) | $3.00-$10.00 |
| Wheelchair (per trip) | $80-$120 |
| Stretcher (per trip) | $250+ |
Timely Filing: 6 months Key Requirements: CPUC permit required, urban rate premiums in major metros, emissions compliance for vehicles, county-specific billing variations
California Medi-Cal NEMT rates rank among the highest nationally, with urban counties in the Bay Area and Los Angeles often exceeding $10 per mile for specialized transport. The tradeoff: California’s regulatory requirements, insurance costs, and operational complexity also rank among the nation’s highest.
Colorado NEMT Billing Rates
Program Type: Broker / FFS Hybrid Medicaid Program: Health First Colorado Broker: MTM (IntelliRide)
| Service Level | Rate Range |
|---|---|
| Ambulatory (per trip) | ~$30 |
| Ambulatory (per mile) | $2.00-$6.00 |
| Wheelchair (per trip) | ~$60 |
| Stretcher (per trip) | ~$150 |
Timely Filing: 90 days Key Requirements: Shortest GPS route mandatory for mileage billing, IntelliRide portal authorization
Colorado’s 90-day timely filing limit is among the shortest nationwide—providers must submit claims promptly to avoid forfeit.
Connecticut NEMT Billing Rates
Program Type: Broker-based Medicaid Program: Connecticut Medicaid Broker: MTM
| Service Level | Rate Range |
|---|---|
| Ambulatory (per trip) | ~$35 |
| Ambulatory (per mile) | $2.50-$8.00 |
| Wheelchair (per trip) | ~$70 |
| Stretcher (per trip) | ~$180 |
Timely Filing: 9 months Key Requirements: PCS required for wheelchair and above, performance incentives available for high-quality providers
Delaware NEMT Billing Rates
Program Type: Managed Care Medicaid Program: Delaware Medicaid Broker: Regional MCO vendors
| Service Level | Rate Range |
|---|---|
| Ambulatory (per trip) | ~$30 |
| Ambulatory (per mile) | $2.00-$7.00 |
| Wheelchair (per trip) | ~$65 |
| Stretcher (per trip) | ~$160 |
Timely Filing: 6 months Key Requirements: PCS required for specialized transport levels
District of Columbia NEMT Billing Rates
Program Type: Managed Care Medicaid Program: DC Medicaid Broker: ModivCare
| Service Level | Rate Range |
|---|---|
| Ambulatory (per trip) | ~$40 |
| Ambulatory (per mile) | $3.00-$9.00 |
| Wheelchair (per trip) | ~$85 |
| Stretcher (per trip) | ~$200 |
Timely Filing: 12 months Key Requirements: Urban GPS validation required, dense metro area with high trip volume potential
DC’s compact geography and high Medicaid population create favorable conditions for NEMT providers—short trips, high density, and above-average rates.
Florida NEMT Billing Rates
Program Type: Managed Care / Broker Medicaid Program: Florida Medicaid (SMMC – Statewide Medicaid Managed Care) Broker: ModivCare, MTM
| Service Level | Rate Range |
|---|---|
| Ambulatory (per trip) | ~$25 |
| Ambulatory (per mile) | $2.00-$7.00 |
| Wheelchair (per trip) | ~$45 |
| Stretcher (per trip) | ~$100 |
| Wait Time | $25-$100/hour |
Timely Filing: 12 months Key Requirements: Wait-time billing common and reimbursable, AHCA oversight, large retiree/dialysis population creates consistent demand
Florida’s wait-time billing provisions distinguish it from many states—providers can bill $25-$100 per hour for extended facility waits, adding meaningful revenue on dialysis and hospital discharge trips.
Georgia NEMT Billing Rates
Program Type: Regional Broker Medicaid Program: Georgia Medicaid Broker: ModivCare, Verida
| Service Level | Rate Range |
|---|---|
| Ambulatory (per trip) | ~$30 |
| Ambulatory (per mile) | $2.00-$7.00 |
| Wheelchair (per trip) | ~$60 |
| Stretcher (per trip) | ~$150 |
Timely Filing: 9 months Key Requirements: Capitated broker contracts, regional rate variations between metro Atlanta and rural areas
Georgia Medicaid NEMT rates are broker-negotiated and vary by region, with Atlanta metro commanding premium rates compared to rural south Georgia.
Hawaii NEMT Billing Rates
Program Type: Managed Care + FFS Taxi Medicaid Program: Med-QUEST Broker: MCO-contracted
| Service Level | Rate Range |
|---|---|
| Ambulatory (per trip) | ~$25 |
| Ambulatory (per mile) | $2.00-$6.00 |
| Wheelchair (per trip) | ~$50 |
| Stretcher (per trip) | ~$120 |
Timely Filing: 6 months Key Requirements: Island-specific logistics, ferry and inter-island air transport supplements available for neighbor island medical travel
Idaho NEMT Billing Rates
Program Type: Statewide Broker Medicaid Program: Idaho Medicaid Broker: MTM
| Service Level | Rate Range |
|---|---|
| Ambulatory (per trip) | ~$28 |
| Ambulatory (per mile) | $1.50-$5.00 |
| Wheelchair (per trip) | ~$55 |
| Stretcher (per trip) | ~$130 |
Timely Filing: 12 months Key Requirements: Long-distance intercity transport incentives for rural areas, significant geography challenges
Illinois NEMT Billing Rates
Program Type: Mixed (Broker + MCO) Medicaid Program: HFS Illinois (Healthcare and Family Services) Broker: ModivCare / First Transit
| Service Level | Rate Range |
|---|---|
| Ambulatory (per trip) | ~$35 |
| Ambulatory (per mile) | $2.50-$8.00 |
| Wheelchair (per trip) | ~$70 |
| Stretcher (per trip) | ~$180 |
Timely Filing: 90 days Key Requirements: Urban mileage caps in Chicago metro, significant rate differences between Cook County and downstate
Illinois providers face a notably short 90-day timely filing window—among the tightest in the nation alongside Colorado and Pennsylvania.
Indiana NEMT Billing Rates
Program Type: Broker + MCO Medicaid Program: IHCP (Indiana Health Coverage Programs) Broker: Verida
| Service Level | Rate Range |
|---|---|
| Ambulatory (per trip) | ~$10-$13 |
| Wheelchair (per trip) | ~$17.70 |
| Mileage | Code-based (S0209) |
Timely Filing: 12 months Key Requirements: IHCP enrollment required before broker contract, among the lowest base rates nationally
Indiana’s per-trip rates rank among the lowest nationwide, with ambulatory trips as low as $10-$13. Providers must rely heavily on mileage and volume to achieve profitability in this market.
Iowa NEMT Billing Rates
Program Type: Broker-based Medicaid Program: Iowa Medicaid Broker: MTM
| Service Level | Rate Range |
|---|---|
| Ambulatory (per trip) | ~$30 |
| Ambulatory (per mile) | $2.00-$6.00 |
| Wheelchair (per trip) | ~$60 |
Timely Filing: 6 months Key Requirements: Rural zone premiums available for long-distance transport
Kansas NEMT Billing Rates
Program Type: FFS / MCO Hybrid Medicaid Program: KanCare Broker: Regional
| Service Level | Rate Range |
|---|---|
| Ambulatory (per trip) | ~$25 |
| Ambulatory (per mile) | $1.80-$7.00 |
| Wheelchair (per trip) | ~$50 |
Timely Filing: 12 months Key Requirements: PCS required for non-ambulatory transport levels
Kentucky NEMT Billing Rates
Program Type: Managed Care Medicaid Program: Kentucky Medicaid Broker: ModivCare
| Service Level | Rate Range |
|---|---|
| Ambulatory (per trip) | ~$32 |
| Ambulatory (per mile) | $2.20-$7.50 |
| Wheelchair (per trip) | ~$65 |
| Stretcher (per trip) | ~$160 |
Timely Filing: 6 months Key Requirements: Appalachian rural add-ons available for eastern Kentucky mountain region transport
Louisiana NEMT Billing Rates
Program Type: Broker-based Medicaid Program: Louisiana Medicaid Broker: ModivCare / MTM
| Service Level | Rate Range |
|---|---|
| Ambulatory (per trip) | ~$28 |
| Ambulatory (per mile) | $2.00-$6.00 |
| Wheelchair (per trip) | ~$55 |
Timely Filing: 9 months Key Requirements: Hurricane exception billing provisions, significant coastal and rural coverage challenges
Maine NEMT Billing Rates
Program Type: Broker / MCO Medicaid Program: MaineCare Broker: MTM
| Service Level | Rate Range |
|---|---|
| Ambulatory (per trip) | ~$35 |
| Ambulatory (per mile) | $2.50-$8.00 |
| Wheelchair (per trip) | ~$70 |
Timely Filing: 12 months Key Requirements: Island and ferry integration for coastal communities, rural mileage considerations
Maryland NEMT Billing Rates
Program Type: Managed Care Medicaid Program: Maryland Medicaid Broker: Regional
| Service Level | Rate Range |
|---|---|
| Ambulatory (per trip) | ~$40 |
| Ambulatory (per mile) | $3.00-$9.00 |
| Wheelchair (per trip) | ~$80 |
| Stretcher (per trip) | ~$200 |
Timely Filing: 6 months Key Requirements: GPS urban verification required in Baltimore metro
Massachusetts NEMT Billing Rates (MassHealth)
Program Type: Broker (HST Office) Medicaid Program: MassHealth Broker: MART, GATRA, regional RTAs
| Service Level | Rate Range |
|---|---|
| Ambulatory (per trip) | ~$45 |
| Ambulatory (per mile) | $3.50-$10.00 |
| Wheelchair (per trip) | ~$90 |
| Stretcher (per trip) | ~$220 |
Timely Filing: 90 days Key Requirements: Strict electronic trip logging mandatory, high labor costs reflected in rates, among the highest-paying states
Massachusetts MassHealth NEMT rates rank among the nation’s highest, reflecting the state’s elevated cost of living and stringent regulatory requirements. The 90-day filing deadline requires disciplined claims management.
Michigan NEMT Billing Rates
Program Type: Managed Care Medicaid Program: Michigan Medicaid Broker: ModivCare
| Service Level | Rate Range |
|---|---|
| Ambulatory (per trip) | ~$30 |
| Ambulatory (per mile) | $2.00-$7.00 |
| Wheelchair (per trip) | ~$60 |
Timely Filing: 12 months Key Requirements: County and MCO variation in rates, significant Detroit metro vs. rural Upper Peninsula differences
Minnesota NEMT Billing Rates
Program Type: Fee-for-Service Medicaid Program: Minnesota Medicaid Broker: None (primary direct billing)
| Service Level | Rate Range |
|---|---|
| Ambulatory (per trip) | ~$35 |
| Ambulatory (per mile) | $2.50-$5.00 |
| Wheelchair (per trip) | ~$70 |
Timely Filing: 6 months Key Requirements: Public procedure codes published, direct Medicaid billing without broker intermediary
Minnesota’s FFS model provides rate transparency uncommon in broker states—providers know exactly what they’ll receive before accepting trips.
Mississippi NEMT Billing Rates
Program Type: Broker-based Medicaid Program: Mississippi Medicaid Broker: MTM
| Service Level | Rate Range |
|---|---|
| Ambulatory (per trip) | ~$25 |
| Ambulatory (per mile) | $1.50-$6.00 |
| Wheelchair (per trip) | ~$50 |
Timely Filing: 9 months Key Requirements: Delta region zone-based rates, among the lower-paying states nationally
Missouri NEMT Billing Rates
Program Type: FFS / Broker Medicaid Program: Missouri Medicaid Broker: MTM
| Service Level | Rate Range |
|---|---|
| Ambulatory (per trip) | ~$32 |
| Ambulatory (per mile) | $2.20-$7.50 |
| Wheelchair (per trip) | ~$65 |
Timely Filing: 12 months Key Requirements: Show-Me Healthy hybrid program structure
Montana NEMT Billing Rates
Program Type: Direct Billing Medicaid Program: Montana Healthcare Programs Broker: MPQH (authorization only, not payment)
| Service Level | Rate Range |
|---|---|
| Ambulatory (per trip) | ~$28 |
| Ambulatory (per mile) | $1.50-$6.00 |
| Wheelchair (per trip) | ~$55 |
Timely Filing: 6 months Key Requirements: Mileage, meal, and lodging reimbursement available for long-distance medical travel—unique among states
Montana’s vast rural geography creates unique billing opportunities including meal and lodging reimbursement for overnight medical trips—provisions rarely available elsewhere.
Section 3 Summary: States A-M Rate Tiers
| Rate Tier | States | Typical Trip Range |
|---|---|---|
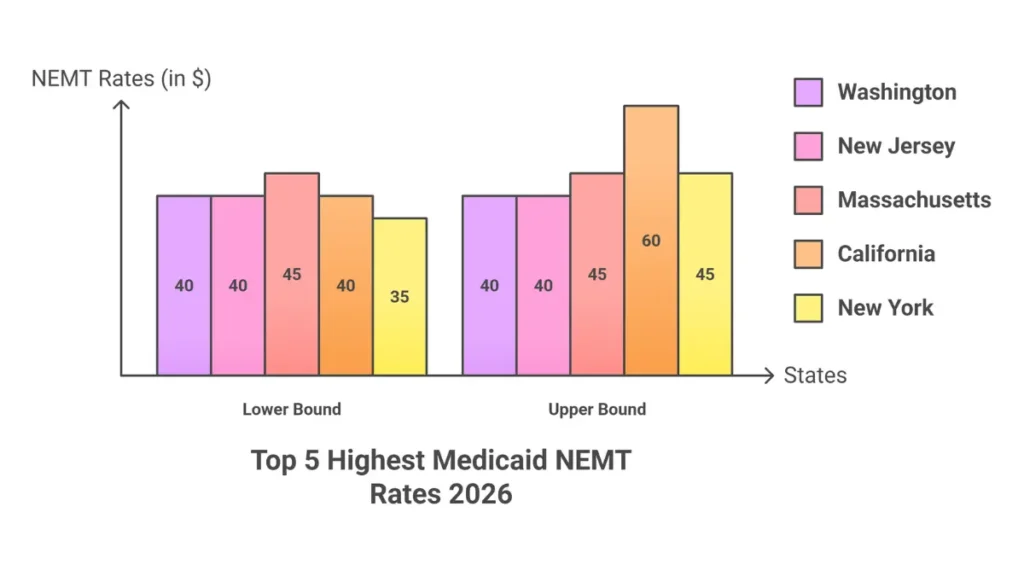
| High | CA, MA, DC, MD | $40-$60+ ambulatory |
| Medium-High | AK, CT, IL, ME | $35-$50 ambulatory |
| Medium | AZ, CO, FL, GA, KY, MI, MN, MO | $28-$35 ambulatory |
| Low | AL, AR, IN, IA, KS, ID, LA, MS, MT | $25-$30 ambulatory |
State-by-State NEMT Rate Directory: N-W
This section continues the state directory with Nebraska through Wyoming. The same format applies—program type, broker information, rate ranges, timely filing deadlines, and key billing requirements for each state.
Nebraska NEMT Billing Rates
Program Type: FFS / Broker Hybrid Medicaid Program: Nebraska Medicaid (Heritage Health / NET) Broker: MTM (regional)
| Service Level | Rate Range |
|---|---|
| Ambulatory (per trip) | ~$28 |
| Ambulatory (per mile) | ~$1.50 |
| Wheelchair (per trip) | ~$55 |
| Wheelchair (per mile) | ~$3.00 |
| Stretcher (per trip) | ~$140 |
| Stretcher (per mile) | ~$6.00 |
Timely Filing: 6 months Key Requirements: Broker prior authorization, loaded miles only, rate freezes noted in recent years
Nevada NEMT Billing Rates
Program Type: Broker-based (MCO expansion planned 2026) Medicaid Program: Nevada Medicaid Broker: Veyo (transitioning to MCOs)
| Service Level | Rate Range |
|---|---|
| Ambulatory (per trip) | ~$35 |
| Ambulatory (per mile) | ~$2.50 |
| Wheelchair (per trip) | ~$70 |
| Wheelchair (per mile) | ~$5.00 |
| Stretcher (per trip) | ~$180 |
| Stretcher (per mile) | ~$8.00 |
Timely Filing: 90 days Key Requirements: Broker portal authorization required, Las Vegas urban premiums, MCO transition may affect rates in 2026
Nevada’s 90-day timely filing limit ranks among the shortest—providers must maintain disciplined billing cycles.
New Hampshire NEMT Billing Rates
Program Type: Managed Care Medicaid Program: New Hampshire Medicaid Broker: MTM
| Service Level | Rate Range |
|---|---|
| Ambulatory (per trip) | ~$32 |
| Ambulatory (per mile) | ~$2.20 |
| Wheelchair (per trip) | ~$65 |
| Wheelchair (per mile) | ~$4.50 |
| Stretcher (per trip) | ~$160 |
| Stretcher (per mile) | ~$7.50 |
Timely Filing: 12 months Key Requirements: MCO authorization, rural mileage incentives for northern counties
New Jersey NEMT Billing Rates
Program Type: Managed Care / Broker Medicaid Program: NJ FamilyCare Broker: ModivCare
| Service Level | Rate Range |
|---|---|
| Ambulatory (per trip) | ~$40 |
| Ambulatory (per mile) | ~$3.00 |
| Wheelchair (per trip) | ~$85 |
| Wheelchair (per mile) | ~$6.00 |
| Stretcher (per trip) | ~$200 |
| Stretcher (per mile) | ~$9.00 |
Timely Filing: 9 months Key Requirements: Metro rate tiers (Newark/Jersey City premium), PCS required for specialized transport
New Jersey Medicaid transportation rates reflect Northeast cost-of-living premiums, placing the state among higher-paying markets nationally.
New Mexico NEMT Billing Rates
Program Type: Broker-based Medicaid Program: Centennial Care Broker: MTM
| Service Level | Rate Range |
|---|---|
| Ambulatory (per trip) | ~$30 |
| Ambulatory (per mile) | ~$2.00 |
| Wheelchair (per trip) | ~$60 |
| Wheelchair (per mile) | ~$4.00 |
| Stretcher (per trip) | ~$150 |
| Stretcher (per mile) | ~$7.00 |
Timely Filing: 6 months Key Requirements: Tribal coordination requirements, broker authorization, significant Native American population requiring culturally appropriate service
New York NEMT Billing Rates
Program Type: FFS + Managed Care Medicaid Program: NY Medicaid (eMedNY) Broker: MAS (Medical Answering Services), MTM (regional)
| Service Level | Rate Range |
|---|---|
| Ambulatory (per trip) | $35-$45 |
| Ambulatory (per mile) | $3.00-$5.00 |
| Wheelchair (per trip) | $85-$100 |
| Wheelchair (per mile) | $5.00-$7.00 |
| Stretcher (per trip) | $150-$250 |
| Stretcher (per mile) | $8.00-$10.00 |
Timely Filing: 6 months Key Requirements: MAS scheduling mandatory for trip authorization, significant NYC vs. upstate rate variations, regional pricing tiers
New York Medicaid NEMT rates are among the highest in the United States, with urban NYC trips exceeding $45 per ride plus mileage. The state’s complex MAS broker system and high operating costs create both opportunity and challenge for providers.
North Carolina NEMT Billing Rates
Program Type: Broker / Managed Care Medicaid Program: NC Medicaid Broker: ModivCare (MTM transition planned 2026)
| Service Level | Rate Range |
|---|---|
| Ambulatory (per trip) | $25-$30 |
| Ambulatory (per mile) | ~$1.80 |
| Wheelchair (per trip) | ~$50 |
| Wheelchair (per mile) | ~$3.50 |
| Stretcher (per trip) | ~$130 |
| Stretcher (per mile) | ~$6.00 |
Timely Filing: 12 months Key Requirements: NCTracks authorization system, post-2025 rate adjustments following managed care transition, NC Medicaid NEMT policy changes ongoing
North Carolina Medicaid NEMT rates were adjusted after 2025 cuts, with partial reversals under managed care pressure. Providers should monitor ongoing NC Medicaid NEMT policy developments.
North Dakota NEMT Billing Rates
Program Type: Fee-for-Service (State-operated) Medicaid Program: North Dakota Medicaid Broker: None (direct state billing)
| Service Level | Rate Range |
|---|---|
| Ambulatory (per mile) | $0.70 (A0080 code) |
| Wheelchair (per trip) | $17.70 |
| Wheelchair (per mile) | $2.52 |
| Stretcher (per mile) | $2.52 |
Timely Filing: 6 months Key Requirements: Loaded miles only, very low base rates, among lowest-paying states nationally
North Dakota’s $0.70 per mile ambulatory rate represents the floor for Medicaid NEMT reimbursement nationwide. The state’s FFS model provides transparency but minimal profitability for most providers. The North Dakota Medicaid fee schedule is publicly available through ND HHS.
Ohio NEMT Billing Rates
Program Type: Managed Care (7 MCOs) Medicaid Program: Ohio Medicaid (ODM – Ohio Department of Medicaid) Broker: Veyo, ModivCare, MTM (varies by MCO)
| Service Level | Rate Range |
|---|---|
| Ambulatory (per trip) | $30-$40 |
| Ambulatory (per mile) | $2.00-$3.00 |
| Wheelchair (per trip) | $60-$90 |
| Wheelchair (per mile) | $4.00-$6.00 |
| Stretcher (per trip) | $150-$220 |
| Stretcher (per mile) | $7.00-$9.00 |
Timely Filing: 6 months (MCO-specific) Key Requirements: MCO credentialing required for each plan separately, rate delegation to individual MCOs, Ohio Medicaid fee schedule lookup available through ODM provider portal. The Ohio Medicaid fee schedule and specific transportation reimbursement rates are published and updated quarterly by the Ohio Department of Medicaid, accessible through their official provider portal and rate lookup tools.
Ohio Medicaid NEMT rates are set by individual MCOs, not a single statewide fee schedule. Providers must credential with CareSource, Molina, Buckeye, Aetna Better Health, UnitedHealthcare, and other MCOs separately—each with potentially different rates. The Ohio Medicaid fee schedule PDF and lookup tools are available online but represent baseline rates that MCOs may adjust.
Oklahoma NEMT Billing Rates
Program Type: Fee-for-Service Medicaid Program: SoonerCare Broker: Regional
| Service Level | Rate Range |
|---|---|
| Ambulatory (per trip) | ~$32 |
| Ambulatory (per mile) | ~$2.20 |
| Wheelchair (per trip) | ~$65 |
| Wheelchair (per mile) | ~$4.50 |
| Stretcher (per trip) | ~$160 |
| Stretcher (per mile) | ~$7.50 |
Timely Filing: 12 months Key Requirements: FY2025 saw 8.96% rate increase—among the largest recent adjustments nationally
Oklahoma’s 8.96% FY2025 rate increase demonstrates that advocacy and market conditions can drive meaningful reimbursement improvements even in traditionally lower-paying states.
Oregon NEMT Billing Rates
Program Type: Managed Care (CCO model) Medicaid Program: Oregon Health Plan Broker: ModivCare / Regional
| Service Level | Rate Range |
|---|---|
| Ambulatory (per trip) | ~$35 |
| Ambulatory (per mile) | ~$2.50 |
| Wheelchair (per trip) | ~$70 |
| Wheelchair (per mile) | ~$5.00 |
| Stretcher (per trip) | ~$180 |
| Stretcher (per mile) | ~$8.00 |
Timely Filing: 6 months Key Requirements: CCO-specific authorization varies by region, Coordinated Care Organization model
Pennsylvania NEMT Billing Rates
Program Type: Managed Care / County Broker Medicaid Program: PA Medical Assistance (MATP – Medical Assistance Transportation Program) Broker: MTM, ModivCare (regional)
| Service Level | Rate Range |
|---|---|
| Ambulatory (per trip) | ~$35 |
| Ambulatory (per mile) | ~$2.50 |
| Wheelchair (per trip) | ~$70 |
| Wheelchair (per mile) | ~$5.00 |
| Stretcher (per trip) | ~$180 |
| Stretcher (per mile) | ~$8.00 |
Timely Filing: 90 days Key Requirements: PROMISe billing system, significant county-by-county variation, Philadelphia metro vs. rural rates differ substantially
Pennsylvania’s 90-day timely filing deadline requires aggressive claims management. The MATP program operates with county-level variation that can significantly impact reimbursement depending on service area.
Rhode Island NEMT Billing Rates
Program Type: Managed Care Medicaid Program: RI Medicaid (EOHHS) Broker: MTM
| Service Level | Rate Range |
|---|---|
| Ambulatory (per trip) | ~$32 |
| Ambulatory (per mile) | ~$2.20 |
| Wheelchair (per trip) | ~$65 |
| Wheelchair (per mile) | ~$4.50 |
| Stretcher (per trip) | ~$160 |
| Stretcher (per mile) | ~$7.50 |
Timely Filing: 12 months Key Requirements: 14.5% FY2025 rate adjustment—among the largest increases nationally
Rhode Island’s 14.5% FY2025 rate adjustment represents one of the most significant recent increases—evidence that states are responding to provider sustainability concerns.
South Carolina NEMT Billing Rates
Program Type: Broker-based Medicaid Program: Healthy Connections Broker: ModivCare
| Service Level | Rate Range |
|---|---|
| Ambulatory (per trip) | ~$28 |
| Ambulatory (per mile) | ~$1.80 |
| Wheelchair (per trip) | ~$55 |
| Wheelchair (per mile) | ~$3.50 |
| Stretcher (per trip) | ~$140 |
| Stretcher (per mile) | ~$6.00 |
Timely Filing: 9 months Key Requirements: Zone-based coverage areas
South Dakota NEMT Billing Rates
Program Type: Fee-for-Service Medicaid Program: South Dakota Medicaid Broker: None (direct state billing)
| Service Level | Rate Range |
|---|---|
| Ambulatory (per trip) | ~$25 |
| Ambulatory (per mile) | ~$1.50 |
| Wheelchair (per trip) | ~$50 |
| Wheelchair (per mile) | ~$3.00 |
| Stretcher (per trip) | ~$130 |
| Stretcher (per mile) | ~$5.00 |
Timely Filing: 6 months Key Requirements: $0.70/mile community transport rate available, among lower-paying states, South Dakota Medicaid fee schedule publicly available
Tennessee NEMT Billing Rates
Program Type: Managed Care Medicaid Program: TennCare Broker: MTM, BlueCare
| Service Level | Rate Range |
|---|---|
| Ambulatory (per trip) | ~$30 |
| Ambulatory (per mile) | ~$2.00 |
| Wheelchair (per trip) | ~$60 |
| Wheelchair (per mile) | ~$4.00 |
| Stretcher (per trip) | ~$150 |
| Stretcher (per mile) | ~$7.00 |
Timely Filing: 12 months Key Requirements: MCO-delegated rates under TennCare program, multiple MCO credentialing required
Texas NEMT Billing Rates
Program Type: Managed Care Medicaid Program: Texas Medicaid (STAR / STAR+PLUS) Broker: MTM, ModivCare, SafeRide
| Service Level | Rate Range |
|---|---|
| Ambulatory (per trip) | $30-$45 |
| Ambulatory (per mile) | $2.00-$4.00 |
| Wheelchair (per trip) | $60-$90 |
| Wheelchair (per mile) | $4.00-$6.00 |
| Stretcher (per trip) | $150-$220 |
| Stretcher (per mile) | $7.00-$9.00 |
Timely Filing: 95 days Key Requirements: Regional metro vs. rural rate tiers, HHSC oversight, significant Houston/Dallas/San Antonio premium vs. rural West Texas
Texas NEMT billing rates vary significantly by region, with major metro areas (Houston, Dallas, San Antonio, Austin) commanding premium rates compared to rural areas. The 95-day timely filing limit is unique to Texas.
Utah NEMT Billing Rates
Program Type: Broker-based Medicaid Program: Utah Medicaid Broker: Veyo
| Service Level | Rate Range |
|---|---|
| Ambulatory (per trip) | ~$28 |
| Ambulatory (per mile) | ~$1.80 |
| Wheelchair (per trip) | ~$55 |
| Wheelchair (per mile) | ~$3.50 |
| Stretcher (per trip) | ~$140 |
| Stretcher (per mile) | ~$6.00 |
Timely Filing: 12 months Key Requirements: Veyo broker authorization, Wasatch Front urban vs. rural rate considerations
Vermont NEMT Billing Rates
Program Type: Managed Care Medicaid Program: Green Mountain Care Broker: MTM
| Service Level | Rate Range |
|---|---|
| Ambulatory (per trip) | ~$35 |
| Ambulatory (per mile) | ~$2.50 |
| Wheelchair (per trip) | ~$70 |
| Wheelchair (per mile) | ~$5.00 |
| Stretcher (per trip) | ~$180 |
| Stretcher (per mile) | ~$8.00 |
Timely Filing: 6 months Key Requirements: Regional public transit integration, rural geography challenges
Virginia NEMT Billing Rates
Program Type: FFS / Managed Care Medicaid Program: Virginia Medicaid (DMAS – Department of Medical Assistance Services) Broker: Regional
| Service Level | Rate Range |
|---|---|
| Ambulatory (per trip) | ~$32 |
| Ambulatory (per mile) | ~$2.20 |
| Wheelchair (per trip) | ~$65 |
| Wheelchair (per mile) | ~$4.50 |
| Stretcher (per trip) | ~$160 |
| Stretcher (per mile) | ~$7.50 |
Timely Filing: 12 months Key Requirements: Public DMAS rate-setting, Northern Virginia premium vs. rural Southwest Virginia
Washington NEMT Billing Rates
Program Type: Managed Care Medicaid Program: Apple Health Broker: ModivCare
| Service Level | Rate Range |
|---|---|
| Ambulatory (per trip) | ~$40 |
| Ambulatory (per mile) | ~$3.00 |
| Wheelchair (per trip) | ~$80 |
| Wheelchair (per mile) | ~$5.00 |
| Stretcher (per trip) | ~$200 |
| Stretcher (per mile) | ~$9.00 |
Timely Filing: 6 months Key Requirements: 10% post-pandemic rate increase, Seattle metro premium, among higher-paying Western states
Washington’s 10% post-pandemic rate increase demonstrates state responsiveness to provider sustainability—and places Apple Health among more attractive Medicaid programs nationally.
West Virginia NEMT Billing Rates
Program Type: Managed Care Medicaid Program: West Virginia Medicaid Broker: MTM
| Service Level | Rate Range |
|---|---|
| Ambulatory (per trip) | ~$28 |
| Ambulatory (per mile) | ~$1.80 |
| Wheelchair (per trip) | ~$55 |
| Wheelchair (per mile) | ~$3.50 |
| Stretcher (per trip) | ~$140 |
| Stretcher (per mile) | ~$6.00 |
Timely Filing: 9 months Key Requirements: Appalachian terrain add-ons for mountain region transport
Wisconsin NEMT Billing Rates
Program Type: FFS / Broker Medicaid Program: BadgerCare Plus Broker: Regional
| Service Level | Rate Range |
|---|---|
| Ambulatory (per trip) | ~$30 |
| Ambulatory (per mile) | ~$2.00 |
| Wheelchair (per trip) | ~$60 |
| Wheelchair (per mile) | ~$4.00 |
| Stretcher (per trip) | ~$150 |
| Stretcher (per mile) | ~$7.00 |
Timely Filing: 12 months Key Requirements: Legacy zone-based rate structure
Wyoming NEMT Billing Rates
Program Type: Fee-for-Service Medicaid Program: Wyoming Medicaid Broker: None (direct state billing)
| Service Level | Rate Range |
|---|---|
| Ambulatory (per trip) | ~$25 |
| Ambulatory (per mile) | ~$1.50 |
| Wheelchair (per trip) | ~$50 |
| Wheelchair (per mile) | ~$3.00 |
| Stretcher (per trip) | ~$130 |
| Stretcher (per mile) | ~$5.00 |
Timely Filing: 6 months Key Requirements: HCBS/ARPA funding expiration affecting rates, rural mileage reliance, sparse population creates long-distance transport challenges
Wyoming’s vast rural geography and small population create unique challenges—providers depend heavily on mileage reimbursement for trips that may span 100+ miles to reach medical facilities.
Section 4 Summary: States N-W Rate Tiers
| Rate Tier | States | Typical Trip Range |
|---|---|---|
| High | NY, NJ, WA | $40-$45+ ambulatory |
| Medium-High | NV, OR, VT, PA | $35-$40 ambulatory |
| Medium | NE, NH, NM, NC, OH, OK, TN, TX, VA, WI | $28-$35 ambulatory |
| Low | ND, SD, SC, UT, WV, WY | $25-$28 ambulatory |
How Much Do NEMT Businesses Make?
Understanding state reimbursement rates only tells part of the story. The real question for providers evaluating markets: how do those rates translate into actual revenue and profit?
NEMT businesses typically generate $120,000-$180,000 in annual revenue per vehicle, with high-rate states like New York and California reaching $200,000-$300,000 per vehicle. At industry-standard profit margins of 15-25%, a well-managed 10-vehicle fleet can net $180,000-$450,000 annually—but results vary dramatically based on state rates, payer mix, and operational efficiency.
Revenue Per Vehicle by State Tier
| State Tier | Example States | Annual Revenue/Vehicle | Key Drivers |
|---|---|---|---|
| High-Rate | NY, CA, NJ, MA | $200,000-$300,000 | High base rates, urban density, wheelchair/stretcher mix |
| Mid-Rate | TX, OH, FL, IL | $130,000-$180,000 | Broker competition, volume-dependent |
| Low-Rate | AL, MS, WY, ND | $80,000-$120,000 | Low FFS rates, long rural mileage |
The math is straightforward: providers in high-rate states generate 2-3x the revenue of low-rate state counterparts for similar trip volumes. This disparity drives strategic decisions about market selection, expansion, and whether operating in certain states makes financial sense.

Revenue by Fleet Size
| Fleet Size | Annual Revenue Range | Typical Net Margin |
|---|---|---|
| 1-4 vehicles | $120K-$500K | 5-15% (thin margins) |
| 5-9 vehicles | $600K-$1.5M | 10-18% (break-even to modest) |
| 10-49 vehicles | $1.5M-$9M | 15-25% (dispatch efficiency gains) |
| 50+ vehicles | $9M-$20M+ | 25-35% (economies of scale) |
Smaller fleets face disproportionate fixed cost burdens—insurance, dispatch software, compliance overhead—that compress margins regardless of state rates. Scale provides leverage that enables profitability even in mid-tier rate markets.
NEMT Profit Margins by Business Model
| Business Model | Typical Net Margin |
|---|---|
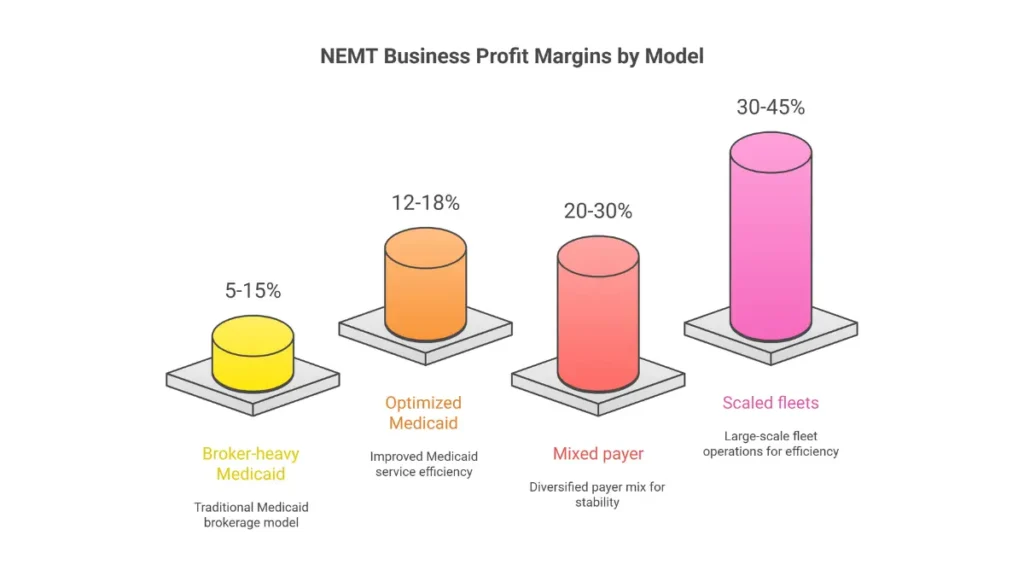
| Broker-heavy Medicaid | 5-15% |
| Optimized Medicaid-focused | 12-18% |
| Mixed payer (Medicaid + MA + private) | 20-30% |
| Scaled/specialized fleets | 30-45% |
The difference between 10% and 30% margins often comes down to payer mix diversification. Providers relying solely on broker-contracted Medicaid trips struggle with compressed rates, while those adding Medicare Advantage and private pay achieve substantially higher margins on blended revenue.
Operating Cost Breakdown
| Cost Category | % of Revenue | Annual Cost/Vehicle |
|---|---|---|
| Driver pay | 35-45% | $40,000-$60,000 |
| Fuel & maintenance | 20-25% | $25,000-$40,000 |
| Insurance | 15-20% | $20,000-$30,000 |
| Admin & software | 10-15% | $15,000-$25,000 |
Driver pay represents the largest variable cost—and the primary lever for margin improvement. Efficient routing that increases trips per driver per day directly improves profitability without requiring rate increases.
How Do NEMT Drivers Get Paid?
NEMT drivers typically earn $15-$25 per hour as employees, or $0.75-$2.00 per loaded mile as independent contractors. Pay structures vary significantly by region, with coastal markets paying premium rates that reflect higher cost of living.
Driver Pay Structures
| Structure | Typical Range | Common Usage |
|---|---|---|
| Hourly (W-2 employee) | $14-$30/hour | Urban fleets, larger companies |
| Per-Mile (1099 contractor) | $0.75-$2.00/mile | Rural areas, owner-operators |
| Per-Trip | $15-$75/trip | Some broker subcontracts |
Employee drivers receive $35,000-$50,000 annually plus benefits (PTO, insurance, 401k), with total cost to company 25-35% higher than base wages.
Independent contractors typically earn $45,000-$60,000 annually with no benefits, taking on fuel, vehicle maintenance, and insurance costs themselves. Contractors receive 20-40% of the company’s per-trip reimbursement.
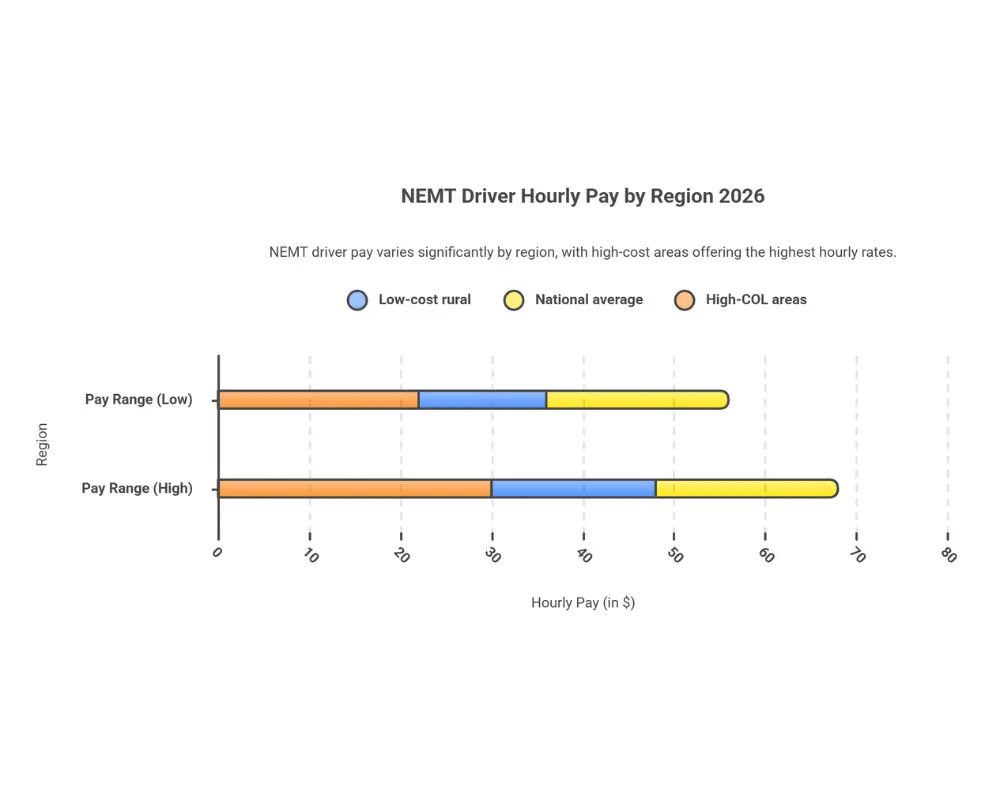
Regional Driver Pay Variations
| Market | Hourly Range | Annual (FT) |
|---|---|---|
| Low-cost rural | $14-$18/hour | $31K-$40K |
| National average | ~$20/hour | ~$42K |
| High-COL (NY/CA/NJ) | $22-$30/hour | $45K-$62K |
| Top metro earners | Up to $30/hour | $60K+ |
Driver pay directly affects provider profitability—but skimping on compensation creates turnover that costs more than the savings. The best operators pay competitively and focus on routing efficiency to offset labor costs.
For a complete overview of NEMT business viability, see our guide on whether NEMT is a good business opportunity.
How to Maximize NEMT Reimbursement in Your State
State rates aren’t entirely fixed—strategic providers capture significantly more revenue than competitors operating in the same markets. The difference comes from payer diversification, service mix optimization, and leveraging every available rate enhancement.
Credential with Multiple Payers
Relying on a single broker or Medicaid program caps your revenue potential. Smart providers credential across multiple channels:
- All regional brokers (MTM, ModivCare, Veyo) operating in your state
- Every MCO if your state uses managed care (Ohio providers may need 7+ MCO credentials)
- Medicare Advantage plans for 20-30% higher rates than Medicaid
- D-SNP plans for mid-day, non-emergency trips to dual-eligible beneficiaries
- Private contracts with dialysis centers, hospitals, and skilled nursing facilities
Target 3-5 active payer relationships to capture approximately 80% of available trip volume in your market. Use CAQH ProView for streamlined multi-payer credentialing.
Understand Rate Variations Within Your State
Many states maintain significant internal rate variations that providers can leverage:
- Urban vs. rural tiers (Texas, California, Pennsylvania)
- County-specific rates (California varies by county, Ohio by MCO)
- Zone-based structures (Arizona, Colorado)
- Metro premiums (NYC, LA, Chicago, Dallas)
Position your service area and fleet to capture higher-rate zones while maintaining coverage for volume in standard-rate areas.
Optimize Service Mix for Profitability
Higher-acuity services generate 2-3x the revenue of ambulatory transport. Strategic fleet composition targets:
- 30-40% wheelchair-capable vehicles
- 10-20% stretcher capability (if market supports)
- Specialty equipment (bariatric, pediatric car seats, oxygen)
Wheelchair and stretcher trips command significant rate premiums, but require additional investment in vehicles, equipment, and training. Balance acuity mix to avoid insurance cost increases exceeding 15% that would offset revenue gains.
Use ambulatory trips as “density fillers” between higher-acuity runs—not as your primary revenue source.
Reduce Denials to Capture Full Revenue
Every denied claim represents revenue at risk. Average NEMT denial rates of 10-20% mean providers leave substantial money uncollected. Reducing denials from 15% to 5% on $1M revenue recovers $100,000 annually.
Key denial reduction tactics:
- Real-time eligibility verification before every trip
- GPS-documented mileage matching billed amounts exactly
- Complete documentation captured at point of service
- Claims submitted within 48 hours of service
For detailed denial prevention strategies, see our complete NEMT billing guide.
Negotiate Better Broker Rates
With direct Medicaid (FFS states): Rates are fixed by fee schedule—no negotiation possible.
With brokers and MCOs: Negotiation is expected. Effective tactics include:
- Begin negotiations 6 months before contract renewal
- Commit volume thresholds (500-2,000 trips/quarter) for rate improvements
- Present performance data: 98%+ on-time rate, <2% no-show, <5% denial rate
- Leverage network adequacy (sole bariatric/stretcher provider in your ZIP)
- Use Medicare Advantage shift as leverage (“We’re moving capacity to higher-rate MA contracts”)
Typical negotiated improvements range from 10-25% above standard broker rates for high-performing, high-volume providers.
How to Charge for Non-Emergency Medical Transportation
Private pay offers an escape from Medicaid rate constraints—with rates typically 2-3x higher and immediate payment.
Private Pay Rate Benchmarks (2025-2026)
| Service Type | Private Pay Range |
|---|---|
| Ambulatory | $50-$100/trip |
| Wheelchair | $100-$250/trip |
| Stretcher | $200-$450/trip |
| Bariatric | $300-$600+/trip |
| Mileage add-on | $2.50-$5.00/mile |
Premium add-ons:
- After-hours (6 PM-6 AM): +25%
- Weekend/holiday: +50%
- Wait time: $25-$50 per 30 minutes
- Oxygen equipment: $50-$100
- Attendant: $30-$60/hour
Payment Terms for Private Pay
- 50% deposit at booking (Stripe/Square)
- Balance due at pickup or Net-15 invoice
- 10-trip packages: 10% discount for commitment
- Cancellation fee: $50 with less than 24-hour notice
- GPS documentation for dispute resolution
Private pay providers report 95%+ collection rates with proper deposit and invoicing systems—dramatically higher than Medicaid’s 80-85% effective collection after denials and delays.
Need help optimizing your billing across multiple payers? Our NEMT billing specialists help providers maximize reimbursement while reducing administrative burden.
Medicare Non-Emergency Medical Transportation Rates
One of the most common questions from NEMT providers: “Does Medicare pay for transportation?” The answer depends entirely on which Medicare program you’re asking about.
Does Traditional Medicare Cover NEMT?
Traditional Medicare (Parts A and B) does NOT cover routine non-emergency medical transportation. This includes:
- ❌ Wheelchair van transport
- ❌ Ambulette services
- ❌ Taxi or rideshare to appointments
- ❌ Transportation to pharmacy, therapy, or routine doctor visits
Traditional Medicare only covers emergency ambulance services when the patient’s medical condition requires ambulance-level care and transport by any other method would endanger the patient’s health. Non-emergency ambulance transport is covered only when a physician certifies that the patient is bed-confined and requires ambulance-level medical supervision during transport.
This limitation creates a common misconception—many providers assume Medicare coverage extends to NEMT because Medicaid covers it. The programs operate under fundamentally different frameworks.
Medicare Advantage NEMT Benefits
Medicare Advantage (Part C) plans increasingly offer NEMT as a supplemental benefit, creating significant revenue opportunities for providers willing to credential with MA plans.
Coverage prevalence in 2025-2026:
- 43-50% of standard MA plans include NEMT benefits
- 67-85% of Special Needs Plans (SNPs) include NEMT
- Up to 100% of VBID (Value-Based Insurance Design) models include transportation
Medicare Advantage NEMT Rates
| Service Level | Typical MA Rate |
|---|---|
| Ambulatory | $60-$120/trip |
| Wheelchair | $80-$150/trip |
| Mileage | $3.00-$8.00/mile |
| Urban blended avg. | ~$100/trip |
Medicare Advantage pays 20-50% higher than Medicaid for comparable services—making MA credentialing a priority for providers seeking rate improvement without changing markets.
Trip Limits and Copays
| Plan Type | Typical Annual Trips | Copay |
|---|---|---|
| Standard MA | 12-24 one-way trips | $0-$5 |
| Generous MA | 24-50 trips | $0-$5 |
| VBID plans | 50+ or unlimited | $0 |
| D-SNP | Often unlimited | $0 |
59% of VBID plans offer $0 copay for transportation—removing patient cost barriers that might otherwise reduce trip volume.
Medicare Advantage NEMT by Insurer
| Insurer | NEMT Generosity | Notes |
|---|---|---|
| UnitedHealthcare | High | Broad coverage, unlimited dialysis-related trips (select plans) |
| Humana | High | Strong chronic care focus (24-36 trips common) |
| Aetna (CVS) | Moderate-High | Urban approved-site flexibility |
| Cigna | Moderate | Regional variability |
| Kaiser Permanente | Selective | Integrated model, less outsourced |
Billing Medicare Advantage for NEMT
To bill Medicare Advantage plans:
- Credential with the MA plan’s contracted transportation broker
- Obtain prior authorization (required for ~70% of routine trips)
- Submit claims via CMS-1500 or EDI 837 through broker portal
- Expect payment within 15-30 days (faster than Medicaid)
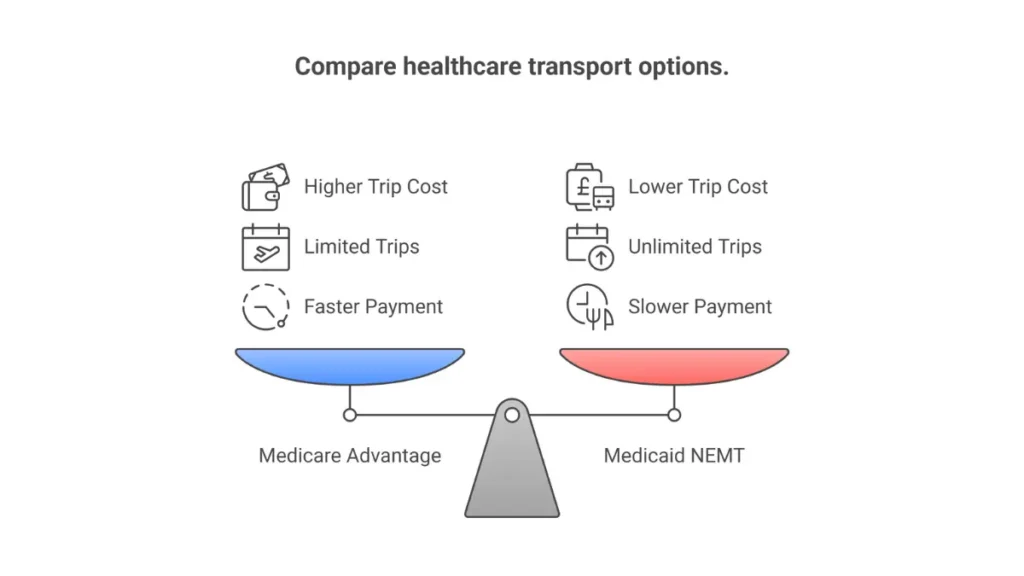
Dual-Eligible Beneficiary Billing
For patients enrolled in both Medicare and Medicaid:
- Medicare Advantage is primary for covered transportation
- Medicaid covers copays and any balance secondarily
- Bill MA first, then coordinate with Medicaid for remaining patient responsibility
The growing Medicare Advantage market—now exceeding 50% of all Medicare beneficiaries—represents an expanding opportunity for NEMT providers willing to navigate MA credentialing and authorization requirements.
Frequently Asked Questions: State NEMT Billing Rates
How much does Medicaid pay NEMT providers?
Medicaid typically pays NEMT providers $25-$90 per trip base fee plus $0.70-$10.00 per loaded mile, depending on state and service type. Ambulatory transport averages $25-$45 per trip nationally. Wheelchair transport commands $45-$90 per trip plus $3-$7 per mile, while stretcher services range from $100-$250 per trip plus $5-$10 per mile in higher-paying states.
What is a Medicaid reimbursement rate?
A Medicaid reimbursement rate is the fixed amount a state pays NEMT providers per service unit—typically per trip, per mile, or per wait-time increment. Rates are established through state fee schedules (FFS states) or broker contract negotiations, reflecting state budgets, operating costs, federal FMAP matching levels, and program design choices.
How do I find my state’s Medicaid NEMT fee schedule?
Visit your state Medicaid or DHHS provider portal and search for “NEMT fee schedule” or “transportation rates.” Some broker-managed states do not publish public fee schedules, requiring providers to request rates directly from contracted brokers like MTM, ModivCare, or Veyo. The Ohio Medicaid fee schedule and North Dakota Medicaid fee schedule are available through their respective state portals.
Why are NEMT rates so different between states?
NEMT rates vary due to differences in state Medicaid budgets, FMAP federal matching percentages (50-77%), cost of living, urban vs. rural geography, and whether states use broker or fee-for-service models. Rural FFS states may pay $1-$3 per mile, while urban broker markets can exceed $5-$10 per mile. The same wheelchair trip might pay $100 in New York but only $35 in Alabama.
Can I negotiate higher NEMT rates?
Providers can negotiate rates with brokers and managed care organizations, especially by offering high trip volumes (500-2,000 trips/quarter), presenting strong performance metrics (98%+ on-time, <5% denials), or demonstrating network adequacy value. Typical negotiated increases range from 10-25% above standard rates. Direct Medicaid fee-for-service rates are generally non-negotiable, but multi-payer credentialing can unlock higher-paying contracts.
How often do NEMT rates change?
Most states review and adjust Medicaid rates annually, typically at the start of the fiscal year (July 1). Some states implement mid-year changes due to inflation or budget pressures. Twenty-six states increased NEMT rates in FY2024, with 20+ states proposing additional increases for FY2025-2026. Providers should monitor state portals quarterly for rate updates.
What’s the difference between broker rates and direct Medicaid rates?
Broker rates are negotiated payments typically 10-30% lower than direct Medicaid fee-for-service rates. Brokers (ModivCare, MTM, Veyo) receive capitated payments from states and retain margins after paying providers. However, brokers offer faster payment (Net 15-30 days vs. 30-90 days) and volume stability that partially offsets lower per-trip reimbursement.
How do I bill Medicaid for NEMT in my state?
NEMT claims are billed using CMS-1500 forms or EDI 837P electronic format with HCPCS codes A0100-A0999 (e.g., A0130 for wheelchair transport). Claims are submitted through state Medicaid portals or broker systems and typically require GPS-verified mileage, eligibility verification, and prior authorization. For complete billing procedures, see our NEMT billing guide.
Are private pay NEMT rates higher than Medicaid?
Yes. Private pay NEMT rates are typically 2-3 times higher than Medicaid reimbursement. While Medicaid may pay $25-$90 per trip, private pay often ranges from $50-$250 per trip, with stretcher services reaching $450+. Private pay also offers faster payment (immediate to Net-15) and profit margins of 40-50% compared to Medicaid’s 12-18%.
Which states pay the highest NEMT rates?
The highest-paying NEMT states include New York, California, Massachusetts, New Jersey, Alaska, and Washington. These states typically reimburse $3-$10 per mile and $35-$60+ per ambulatory trip, driven by high labor costs, elevated cost of living, and broker premium structures in urban markets.
Which states pay the lowest NEMT rates?
The lowest NEMT rates are found in Alabama, Mississippi, Wyoming, North Dakota, and South Dakota. Rural fee-for-service states may pay as little as $0.70-$3 per mile and $20-$35 per ambulatory trip. North Dakota’s $0.70 per mile ambulatory rate represents the floor for Medicaid NEMT reimbursement nationally.
How much does non-emergency medical transport cost per mile?
Medicaid reimburses $0.70-$10.00 per loaded mile for NEMT, with national averages between $2.50-$5.00 depending on service type and state. Ambulatory transport averages $2-$3.50 per mile, wheelchair transport $3-$5 per mile, and stretcher services $5-$10 per mile. States only reimburse loaded miles—patient in vehicle—verified through GPS documentation.
Conclusion: Making State Rate Data Actionable
State NEMT reimbursement rates vary by more than 300%—a spread that determines business viability before you complete your first trip. The providers who succeed understand these variations and make strategic decisions accordingly:
- Market selection based on rate tiers, not just proximity
- Payer diversification beyond single-broker Medicaid dependence
- Service mix optimization toward higher-acuity, higher-rate transport
- Rate negotiation leveraging performance data and volume commitments
This guide provides the foundation—current rates for all 50 states plus DC, rate structure explanations, and optimization strategies. But rates change, brokers transition, and state policies evolve. Build relationships with your state Medicaid agency and broker contacts to stay current on changes that affect your bottom line.
For providers seeking to maximize revenue without adding administrative burden, professional billing expertise makes the difference between leaving money on the table and capturing every dollar you’ve earned.
Contact our NEMT billing specialists for a free reimbursement analysis—we’ll identify exactly where your operation can improve collections and optimize payer mix for your specific state and market.