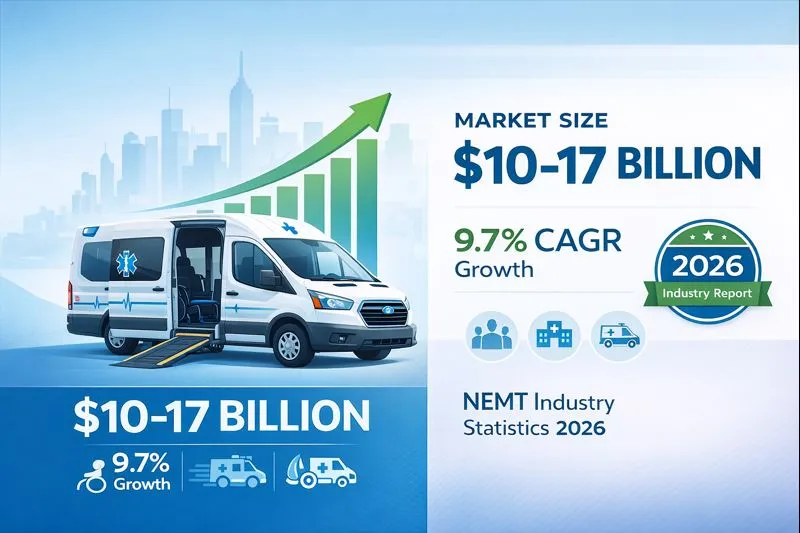
The non-emergency medical transportation industry has quietly become one of healthcare’s most dynamic sectors. With the global market valued between $10.76 billion and $16.71 billion in 2024, NEMT industry statistics reveal a sector poised for explosive growth through the end of the decade.
But here’s what makes these numbers truly significant: 3.6 million Americans miss medical appointments every year simply because they can’t get there. That transportation gap costs the US healthcare system a staggering $150 billion annually in missed appointments, delayed treatments, and preventable emergency room visits.
Whether you’re an NEMT provider looking to expand, a healthcare administrator seeking transportation solutions, or an investor evaluating market opportunities, this comprehensive report delivers every statistic you need. We’ve compiled data from over 20 authoritative sources to create the most complete NEMT market analysis available for 2026.
Table of Contents
Executive Summary: NEMT Industry at a Glance (2026)
Before diving into detailed analysis, let’s establish the fundamental NEMT industry statistics that define this market in 2026.
Key Statistics Snapshot
| Metric | 2024-2025 Value | Projected 2030-2031 |
|---|---|---|
| Global Market Size | $10.76B – $16.71B | $18B – $31.87B |
| US Market Size | $4.4B – $6.6B | $10.25B – $13.44B |
| Industry CAGR | 7.1% – 9.7% | Sustained growth |
| Medicaid NEMT Spending | $3+ Billion annually | Increasing |
| Americans Missing Care (Transport) | 3.6 Million | Declining with NEMT growth |
| Medicare Advantage Plans with NEMT | 36% | 50%+ expected |
| US Population 65+ | 58 Million | 73 Million (2030) |
| Estimated Annual US NEMT Trips | 200 Million | Growing |
Why These NEMT Statistics Matter in 2026
The numbers tell a compelling story. Transportation isn’t just a convenience issue—it’s a healthcare crisis hiding in plain sight. When the American Hospital Association reports that millions of Americans skip necessary medical care because they lack reliable transportation, the implications ripple through the entire healthcare system.
Consider what happens when a dialysis patient misses their thrice-weekly treatment. Or when an elderly patient with diabetes skips a medication management appointment. These missed encounters don’t just affect individual health outcomes—they drive up costs for everyone through emergency interventions that could have been prevented.
The NEMT industry exists to solve this problem. And as our population ages and chronic disease prevalence rises, the demand for non-emergency medical transportation will only accelerate.
Quick Facts for Decision Makers
For NEMT Providers:
- Market fragmentation means opportunity—no single company controls more than 5% of the total market
- Mental health transportation is the fastest-growing application segment at 10.11% CAGR
- Technology adoption separates successful providers from struggling ones
For Healthcare Administrators:
- Every $1 invested in NEMT services generates $11 in healthcare savings
- Transportation assistance can reduce no-show rates by up to 70%
- 84% of health plan professionals cite transportation as the greatest barrier to care
For Investors:
- Asia-Pacific represents the fastest-growing regional market at 10.24% CAGR
- Managed care organization contracts show 10.04% CAGR growth
- Consolidation activity is accelerating, creating M&A opportunities
If you’re exploring whether to enter this market, our comprehensive guide on whether NEMT is a profitable business breaks down the financial opportunity in detail.
How Big is the NEMT Industry? Market Size Analysis
“How big is the NEMT industry?” This question drives countless business decisions, investment analyses, and policy discussions. The answer depends on which research firm you ask—but all agree on one thing: the market is substantial and growing rapidly.
Global NEMT Market Size (2024-2026)
Different market research firms employ varying methodologies, leading to a range of estimates. Here’s how the leading analysts value the global NEMT market:
| Research Firm | 2024 Value | 2025 Value | Methodology Focus |
|---|---|---|---|
| The Insight Partners | $16.71 Billion | — | Comprehensive global |
| Mordor Intelligence | $10.76 Billion | $11.80 Billion | Service-focused |
| Research and Markets | $9.16 Billion | $9.82 Billion | Conservative estimate |
| Business Research Company | $8.86 Billion (2023) | — | Regional analysis |
| Market Research Future | $9.32 Billion | — | Segment-weighted |
| Business Research Insights | — | $11.76 Billion | Technology-inclusive |
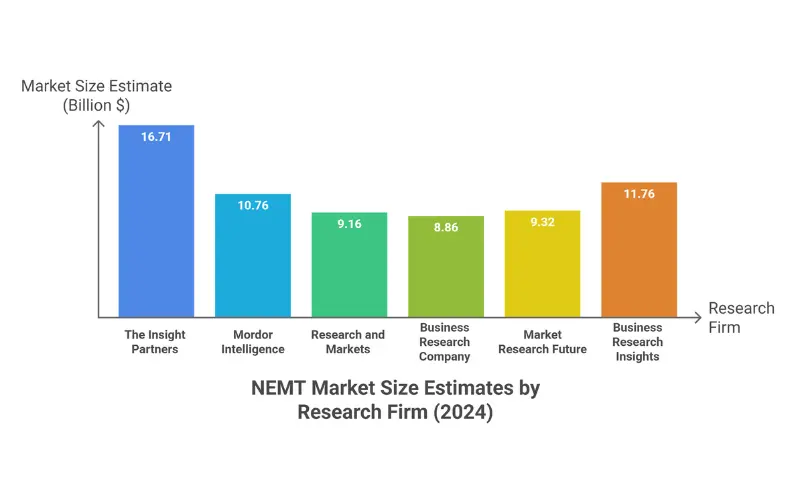
Why such variation? The discrepancy stems from how each firm defines “NEMT.” Some include only direct patient transportation services. Others incorporate courier services for medical supplies, specialized vehicle manufacturing, and technology platform revenues. Geographic scope also varies—some reports focus heavily on North America while others weight international markets more heavily.
The practical takeaway: The global NEMT market falls somewhere between $10 billion and $17 billion in 2024-2025, with the variance reflecting different market definitions rather than fundamental disagreement about the industry’s scale.
US NEMT Market Size Breakdown
The United States dominates the global NEMT landscape, accounting for approximately 41-45% of worldwide revenue. Here’s what we know about the American market specifically:
| Metric | Value | Source |
|---|---|---|
| US Market Size (2024) | $4.4 – $6.6 Billion | Multiple research firms |
| US Market CAGR | 8-9.3% | Industry consensus |
| Projected US Market (2028) | $10.25 Billion | NEMTrepreneur |
| Projected US Market (2031) | $13.44 Billion | Business Market Insights |
| North America Market Share | 41.23% – 45% | Regional analysis |
The US market’s size reflects several unique factors. Our healthcare system’s complexity, combined with Medicaid’s NEMT mandate dating back to 1965, creates consistent baseline demand. Add the aging baby boomer population and rising chronic disease rates, and you understand why America represents the world’s largest NEMT market.
Market Size by Service Segment
Breaking down the market by service type reveals where the money actually flows:
Insurance-Backed Patient Transportation commands the largest share. This segment includes Medicaid-funded trips, Medicare Advantage transportation benefits, and commercial insurance coverage. Medicaid alone accounts for approximately 52% of all NEMT payments—a dominance that shapes the entire industry’s economics.
Private Pay Transportation represents the fastest-growing segment. As awareness of NEMT services spreads beyond Medicaid populations, self-pay demand is rising. Patients who don’t qualify for government programs but need reliable medical transportation increasingly pay out-of-pocket for these services.
Courier Services for medical specimens, equipment, and prescription delivery complete the market picture. While smaller than patient transportation, this segment shows steady growth as healthcare delivery becomes more decentralized.
For providers navigating this market, understanding reimbursement is critical. Our complete NEMT billing guide covers everything from coding to collections.
NEMT Growth Projections: 2025-2032 Forecast
Understanding where the NEMT industry is headed matters as much as knowing where it stands today. Let’s examine what market analysts project for the coming years.
Compound Annual Growth Rate (CAGR) Analysis
Every major research firm forecasts robust growth, though their specific CAGR projections vary:
| Research Firm | CAGR Projection | Forecast Period | 2030/2031 Target |
|---|---|---|---|
| The Insight Partners | 9.7% | 2025-2031 | $31.87 Billion |
| Mordor Intelligence | 8.23% | 2026-2031 | $18.93 Billion |
| Research and Markets | 7.23% | 2025-2030 | $13.93 Billion |
| Business Research Company | 7.7% | 2025-2029 | $13.71 Billion |
| Market Research Future | 5.89% | 2025-2035 | $17.49 Billion |
| 360iResearch | 7.13% | 2024-2030 | $13.87 Billion |
Consensus range: 7.1% – 9.7% CAGR through 2030-2031
To put these growth rates in perspective, the broader healthcare services industry grows at roughly 5-6% annually. The NEMT sector consistently outpaces this benchmark, reflecting its positioning at the intersection of multiple growth trends.
Year-by-Year Market Projections
Based on synthesized research, here’s how the global NEMT market is expected to evolve:
| Year | Conservative Estimate | Mid Estimate | Aggressive Estimate |
|---|---|---|---|
| 2025 | $9.82 Billion | $11.26 Billion | $12.21 Billion |
| 2026 | $10.5 Billion | $12.3 Billion | $13.4 Billion |
| 2027 | $11.3 Billion | $13.4 Billion | $14.7 Billion |
| 2028 | $12.1 Billion | $14.6 Billion | $16.1 Billion |
| 2029 | $13.0 Billion | $15.9 Billion | $17.6 Billion |
| 2030 | $13.9 Billion | $17.3 Billion | $19.3 Billion |
| 2031 | $14.9 Billion | $18.9 Billion | $31.87 Billion |
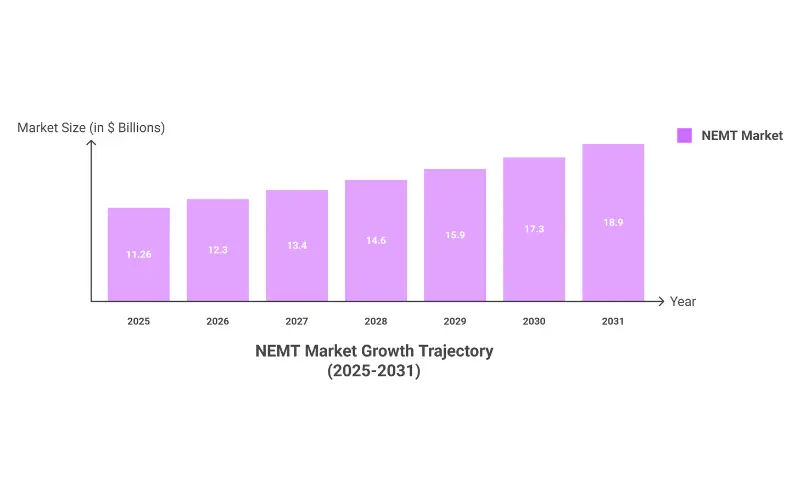
The wide range in 2031 projections reflects uncertainty about several factors: the pace of Medicare Advantage NEMT adoption, technology disruption from ride-hailing companies, and potential regulatory changes affecting Medicaid coverage.
Segment-Specific Growth Rates
Not all NEMT segments grow equally. Understanding which areas are expanding fastest helps providers and investors focus their resources:
By Application:
| Application | Projected CAGR | Market Dynamic |
|---|---|---|
| Mental Health Transportation | 10.11% | Fastest growing |
| Hospital Discharge Transport | 9-10% | High growth |
| Rehabilitation Transport | 8-9% | Strong growth |
| Dialysis Transportation | 8-9% | Large base, steady growth |
| Routine Doctor Visits | 7-8% | Volume leader |
By Payer Type:
| Payer Category | Projected CAGR | Market Dynamic |
|---|---|---|
| Managed Care Organizations | 10.04% | Fastest growing |
| Medicare/Medicare Advantage | 9-10% | Expanding benefits |
| Private Pay | 8-9% | Premium services |
| Medicaid | 6-7% | Large base, steady |
By End User:
| Destination Type | Projected CAGR | Market Dynamic |
|---|---|---|
| Home Healthcare Settings | 10.17% | Fastest growing |
| Mental Health Facilities | 10%+ | Rising demand |
| Dialysis Centers | 8-9% | Reliable volume |
| Hospitals & Clinics | 7-8% | Largest share (38%) |
The message is clear: mental health transportation, home healthcare settings, and managed care contracts represent the highest-growth opportunities. Providers positioning themselves in these segments can expect above-average expansion.
For those considering dialysis transportation specifically—currently 29.42% of the market—our detailed guide on NEMT billing for dialysis patients covers the specialized requirements for this lucrative segment.
Regional Growth Patterns
Geography matters significantly in NEMT growth projections:
| Region | 2024 Market Share | Projected CAGR | Key Driver |
|---|---|---|---|
| North America | 41.23% | 8-9% | Aging population, Medicaid |
| Asia-Pacific | ~25% | 10.24% | Universal coverage expansion |
| Europe | ~20% | 6-7% | Government healthcare systems |
| Latin America | ~8% | 8-9% | Infrastructure development |
| Middle East & Africa | ~6% | 7-8% | Healthcare modernization |
Asia-Pacific’s 10.24% CAGR makes it the fastest-expanding regional market. China alone is projected to reach $5.0 billion by 2030, driven by government investments in healthcare accessibility and a rapidly aging population.
What Drives NEMT Industry Growth? Key Market Drivers
Understanding why the NEMT industry is growing helps predict where it’s headed. Four primary forces drive demand expansion.
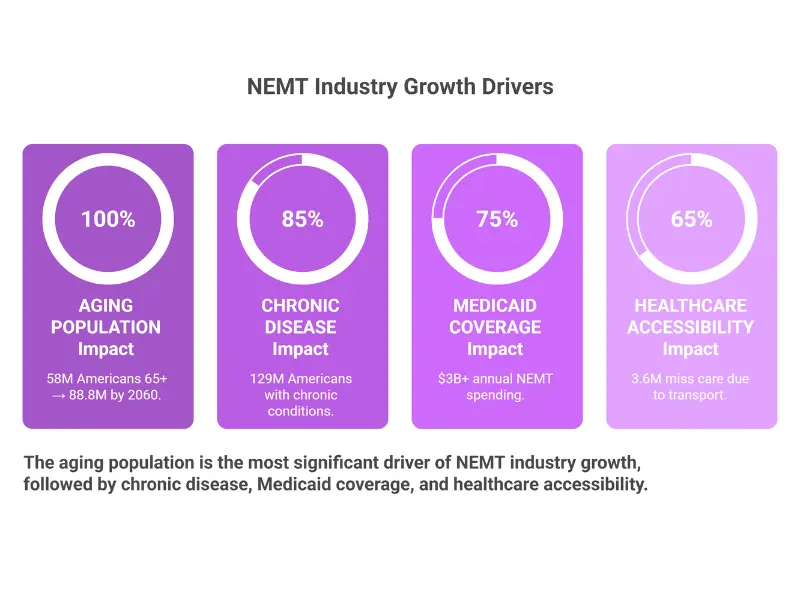
The Aging Population: Primary Growth Engine
The demographic shift underway in America fundamentally reshapes healthcare transportation demand.
| Demographic Metric | Current (2025) | 2030 Projection | 2060 Projection |
|---|---|---|---|
| US Population 65+ | 58 Million | 73 Million | 88.8 Million |
| Percentage of Total Population | ~17% | 20% (1 in 5) | ~23% |
| Population 85+ | ~7 Million | ~9 Million | 19+ Million (tripling) |
| Daily Americans Turning 65 | ~10,000 | ~10,000 | Declining post-2030 |
Here’s why these numbers matter for NEMT: Adults 65 and older book 3.2 times more medical visits than younger cohorts. They see more specialists, require more follow-up care, and manage more chronic conditions. Yet many lose the ability or confidence to drive safely.
The National Council on Aging reports that 93% of older adults have at least one chronic condition, and approximately 80% have two or more. Each condition requires ongoing medical management—appointments that won’t happen if transportation barriers exist.
By 2030, when all baby boomers have crossed the 65 threshold, one in five Americans will be retirement age or older. This “silver tsunami” represents guaranteed NEMT demand growth for the foreseeable future.
Chronic Disease Prevalence: Recurring Transport Needs
Chronic conditions don’t just require occasional doctor visits—they demand ongoing, often predictable transportation needs:
| Condition | US Patients | Typical Visit Frequency | Annual Trips |
|---|---|---|---|
| ESRD/Dialysis | 550,000+ | 3x per week | 156 |
| Cancer (active treatment) | 1.9 Million | Varies by protocol | 24-100+ |
| Diabetes (managed) | 37 Million | Monthly to quarterly | 4-12 |
| Heart Disease | 30 Million | Regular monitoring | 6-12 |
| Mental Health Conditions | 57 Million | Weekly to monthly | 12-52 |
129 million Americans now live with at least one chronic disease. The CDC projects that by 2030, 40% of adults 65 and older will have three or more chronic conditions requiring coordinated care.
Dialysis patients represent the NEMT industry’s most reliable revenue source. Each patient needs transportation three times weekly, 52 weeks per year—156 annual trips with predictable scheduling. This segment alone accounts for nearly 30% of the total NEMT market.
Medicaid Coverage: The Industry’s Foundation
Medicaid has required NEMT coverage since 1965, making it the industry’s bedrock payer:
| Medicaid NEMT Metric | Value |
|---|---|
| Annual Medicaid NEMT Spending | $3+ Billion |
| NEMT as % of Total Medicaid | Less than 1% |
| Beneficiaries Using NEMT | 3-4 Million annually |
| % of Beneficiaries Using NEMT | 4-5% |
| Annual NEMT Ride-Days (FY 2018) | 60+ Million |
While NEMT represents less than 1% of Medicaid’s $900+ billion annual budget, it enables billions more in healthcare utilization. Patients who can reach their appointments use preventive services, manage chronic conditions effectively, and avoid costly emergency interventions.
States have recently recognized NEMT’s value by increasing reimbursement rates:
- Illinois: 40% average rate increase (FY 2024)
- Ohio: 79% increase for certain services (FY 2024)
- 21 states implemented FFS NEMT rate increases in FY 2024
For providers navigating state-specific rates, our Medicaid NEMT rates by state guide provides current reimbursement data.
Healthcare Accessibility Recognition: Transportation as SDOH
Healthcare systems increasingly recognize transportation as a social determinant of health (SDOH). This recognition drives investment:
| Healthcare Impact Metric | Value | Source |
|---|---|---|
| Annual cost of missed appointments | $150 Billion | MTAC Coalition |
| Average cost per no-show | $200 | Healthcare Finance News |
| Americans missing care due to transport | 3.6 Million | American Hospital Association |
| Americans delaying care due to transport | 5.8 Million | UC Davis Health |
| Healthcare savings per $1 spent on NEMT | $11 | Florida State University |
A 2024 SafeRide Health survey of nearly 100 health plan professionals found:
- 66% cited addressing SDOH as their top concern
- 84% said transportation creates the greatest barrier to care
- Transportation ranked #1 among SDOH factors affecting member health
This recognition translates into action. 36% of Medicare Advantage plans now include NEMT benefits—up from roughly 15% in 2020. As value-based care models tie reimbursement to outcomes, health plans increasingly view transportation assistance as an investment rather than an expense.
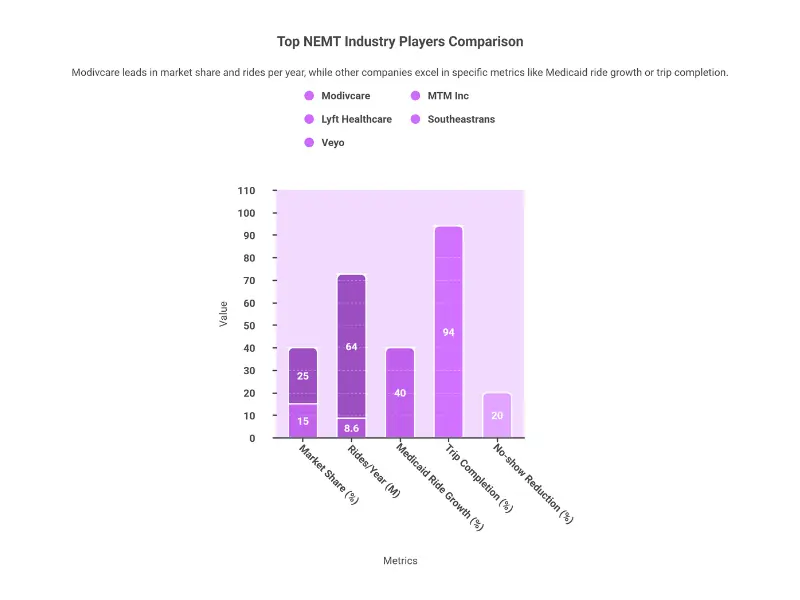
Who Are the Largest NEMT Providers? Market Share Analysis
The NEMT industry remains highly fragmented, with no single company controlling more than 5% of the total market. This fragmentation creates both challenges (inconsistent service quality) and opportunities (room for new entrants and consolidation).
Market Concentration Overview
| Market Structure Metric | Value |
|---|---|
| Largest Company Market Share | ~25% (broker market) |
| Top 5 Companies Combined Share | ~35% |
| Total Active NEMT Providers (US) | Thousands |
| Market Concentration Status | Highly fragmented |
The distinction between “broker market share” and “total market share” matters. Large brokers like ModivCare manage transportation networks but don’t own most vehicles—they contract with independent providers. When we say ModivCare has ~25% market share, we’re referring to trips they coordinate, not the overall industry.
Top NEMT Brokers and Companies
ModivCare (formerly LogistiCare)
| Metric | Value |
|---|---|
| Market Position | #1 Largest NEMT broker in US |
| Estimated Broker Market Share | ~25% |
| Annual Rides Coordinated | 64 Million |
| Members Served | 24 Million |
| Geographic Coverage | 30+ states |
| Recent Development | Integration Hub launch (May 2024) |
ModivCare dominates the national NEMT landscape through extensive state Medicaid contracts and a sophisticated technology platform. Their scale enables efficiency but also draws criticism when service quality issues arise in specific markets.
MTM Inc.
| Metric | Value |
|---|---|
| Market Position | Largest privately-held NEMT broker |
| Geographic Coverage | All 50 states (post-acquisition) |
| Annual Trips | 8.6+ Million |
| Recent Acquisition | Access2Care (October 2024) |
| Revenue Impact | 25% increase from acquisition |
MTM’s 2024 acquisition of Access2Care transformed them into a truly national competitor. The deal expanded their geographic footprint to all 50 states and significantly increased their trip volume.
Lyft Healthcare
| Metric | Value |
|---|---|
| Estimated NEMT Market Share | ~15% |
| Key Advantage | Consumer technology platform |
| Growth Indicator | 40% increase in Medicaid ride volume |
| Focus | Technology integration, on-demand trips |
Lyft has aggressively pursued healthcare transportation, leveraging its consumer ride-hailing technology and massive driver network for NEMT applications. Their API integrations with health plans and providers enable seamless trip booking.
Other Major Players
| Company | Focus Area | Notable Characteristic |
|---|---|---|
| Southeastrans | Regional (Southeast US) | 94% trip completion rate |
| Veyo | Tech-forward broker | 20% no-show reduction achieved |
| Uber Health | Ride-hailing healthcare | HIPAA-compliant, 250+ US cities |
| Global Medical Response | National ambulance/NEMT | Diversified transport |
| Transdev | International presence | Global operations |
| SafeRide Health | Technology platform | Health plan focus |
| Roundtrip | Hospital discharge | Specialty niche |
Recent M&A Activity (2024-2025)
The fragmented market is consolidating:
| Deal | Date | Strategic Significance |
|---|---|---|
| MTM acquires Access2Care | October 2024 | National expansion, 25% revenue boost |
| ModivCare Integration Hub | May 2024 | Industry-first digital platform |
| Uber Health expansion | June 2024 | HIPAA-compliant, healthcare focus |
| Curb Optima launch | September 2024 | AI-powered scheduling for NEMT |
For providers seeking contracts with these major brokers, our guide on NEMT broker billing explains how to navigate these relationships profitably.
How Lucrative is the NEMT Business? Revenue & Profitability
“Is NEMT business profitable?” This question drives countless entrepreneurial decisions. The answer: yes, but margins vary significantly based on service type, geographic market, and operational efficiency.
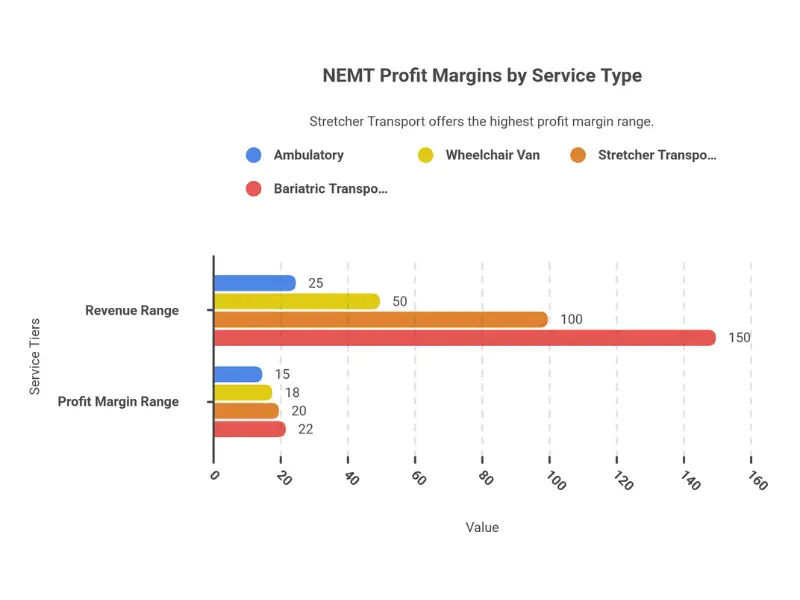
NEMT Profit Margin Analysis
| Service Type | Typical Revenue/Trip | Estimated Profit Margin |
|---|---|---|
| Ambulatory (sedan) | $25-45 | 15-25% |
| Wheelchair Van | $50-80 | 18-28% |
| Stretcher Transport | $100-200 | 20-30% |
| Bariatric Transport | $150-250 | 22-32% |
| Long-Distance Medical | $200-500+ | 25-35% |
These margins assume efficient operations with adequate trip volume. New providers typically see lower margins until they optimize routes and build consistent volume.
Revenue Potential by Patient Type
Understanding revenue per patient helps with business planning:
| Patient Type | Trips/Year | Revenue/Trip | Annual Revenue |
|---|---|---|---|
| Dialysis (wheelchair) | 156 | $75 | $11,700 |
| Dialysis (ambulatory) | 156 | $35 | $5,460 |
| Dialysis (stretcher) | 156 | $175 | $27,300 |
| Chemotherapy | 24-48 | $50-100 | $1,200-4,800 |
| Mental Health (weekly) | 52 | $40 | $2,080 |
| PT/Rehabilitation | 50-100 | $40 | $2,000-4,000 |
A single dialysis patient requiring wheelchair transport generates nearly $12,000 in annual revenue. With average dialysis patient lifespans on treatment of 5-10 years, that’s $60,000-$120,000 in lifetime value per patient.
How Much Do NEMT Owners Make?
Owner income varies dramatically based on operation size:
| Business Size | Fleet Size | Annual Revenue | Owner Income Range |
|---|---|---|---|
| Solo Operator | 1 vehicle | $75,000-150,000 | $40,000-70,000 |
| Small Operation | 2-5 vehicles | $200,000-500,000 | $60,000-120,000 |
| Medium Operation | 6-15 vehicles | $500,000-1.5M | $100,000-250,000 |
| Large Operation | 16+ vehicles | $1.5M+ | $200,000+ |
These figures assume owner-operators actively managing their businesses. Passive ownership with hired management reduces owner income but enables scaling.
Medicaid Reimbursement Rates
Medicaid rates vary significantly by state and service type:
| State | Base Trip Rate | Wheelchair Rate | Stretcher Rate |
|---|---|---|---|
| New York | $35-50 | $55-75 | $125-175 |
| California | $30-45 | $50-70 | $100-150 |
| Texas | $25-40 | $45-65 | $90-130 |
| Florida | $28-42 | $48-68 | $95-140 |
| Pennsylvania | $32-48 | $52-72 | $110-160 |
These are approximate ranges—actual rates depend on specific service codes, modifiers, and contract terms. For current state-specific rates, see our Medicaid NEMT rates by state resource.
Cost Structure Reality
Understanding costs is as important as understanding revenue:
| Cost Category | % of Revenue | Per Trip Estimate |
|---|---|---|
| Driver Wages | 35-45% | $15-25 |
| Fuel | 12-18% | $5-10 |
| Vehicle (lease/depreciation) | 10-15% | $4-8 |
| Insurance | 8-12% | $3-6 |
| Administrative | 5-8% | $2-4 |
| Maintenance | 4-6% | $2-3 |
| Technology/Software | 2-4% | $1-2 |
The largest controllable cost is labor. Driver wages account for 35-45% of revenue, making recruitment, retention, and productivity critical to profitability.
For a detailed financial analysis of starting an NEMT business, our comprehensive guide on whether NEMT is a profitable business covers startup costs, break-even analysis, and realistic income projections.
NEMT Industry Trends Reshaping the Market (2025-2026)
Technology and market dynamics are transforming how NEMT services operate. Here are the trends reshaping the industry.
Technology Adoption: The Great Differentiator
Technology separates thriving NEMT providers from struggling ones:
| Technology | Adoption Impact | Measured Improvement |
|---|---|---|
| Automated scheduling | Operational efficiency | 45% reduction in booking errors |
| Real-time GPS tracking | Service quality | 30% reduction in patient wait times |
| Data analytics | Cost management | 25% lower operational costs |
| AI-powered routing | Resource optimization | 30% cut in call center volume |
| On-time performance | Service delivery | 96% on-time pickup achievement |
| Broker-integrated software | Revenue cycle | 40% faster claim processing |
| Billing automation | Collections | 65% fewer billing errors |
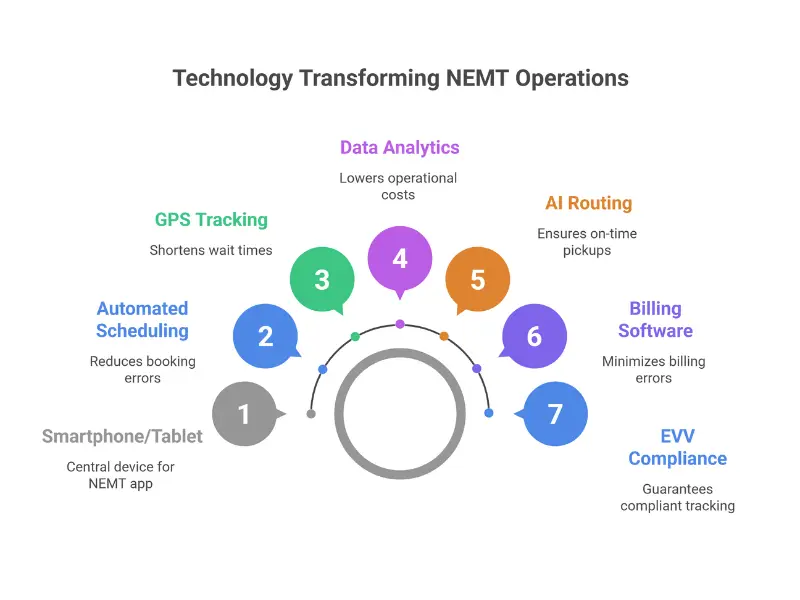
Providers using modern NEMT software solutions report dramatically better outcomes across every operational metric. The technology investment pays for itself through efficiency gains and reduced errors.
Electronic Visit Verification (EVV) Compliance
Federal EVV mandates continue driving technology adoption:
- GPS-based pickup/drop-off verification now standard
- Real-time trip status tracking required in most states
- Automated compliance documentation reduces audit risk
- Fraud prevention through location verification
States increasingly tie NEMT reimbursement to EVV compliance. Providers without compliant systems face claim denials and potential exclusion from programs.
Ride-Hailing Integration
The entry of Uber Health and Lyft Healthcare has permanently changed the competitive landscape:
Uber Health (June 2024 expansion):
- HIPAA-compliant operations
- Coverage in 250+ US cities
- Focus on smaller healthcare organizations
- API integration with health systems
Lyft Healthcare:
- ~15% estimated NEMT market share
- 40% growth in Medicaid patient ride volume
- Deep health plan and broker partnerships
- Seamless booking API
These platforms excel at ambulatory transport for lower-acuity patients. Traditional NEMT providers retain advantages in wheelchair, stretcher, and specialized transport—services requiring specific vehicles and trained personnel.
Electric Vehicle Adoption
Sustainability concerns are driving fleet evolution:
| Vehicle Trend | Current Status | Projected CAGR |
|---|---|---|
| Hybrid/Electric Vehicles | Growing segment | 9.98% |
| Wheelchair-Accessible EVs | Emerging options | Accelerating |
| Fleet Electrification | Early adopter phase | Increasing |
Wheelchair-accessible electric options are expanding, including Chrysler Pacifica Hybrid conversions, Ford E-Transit, and Toyota Sienna Hybrid. Operating cost advantages (lower fuel, reduced maintenance) make EVs increasingly attractive for high-mileage NEMT operations.
Regulatory Evolution
Policy changes continue shaping the industry:
| Regulatory Change | Impact | Timeline |
|---|---|---|
| CMS 2026 Quality Reporting | Transport experience in Medicaid quality metrics | 2026 |
| Prior Authorization Windows | Cut from 10 to 7 calendar days in some states | Ongoing |
| Driver Certification | Oregon, New York mandating additional training | Expanding |
| Fraud Prevention | Stricter documentation and verification | Intensifying |
The CMS 2026 rules embedding transportation experience in Medicaid quality reporting will force health plans to prioritize NEMT performance. Providers demonstrating superior service quality will become preferred partners.
For help navigating NEMT prior authorization requirements, our detailed guide covers state-specific rules and best practices.
State-by-State NEMT Statistics: Regional Analysis
NEMT demand and program structure vary dramatically by state. Here’s how the landscape breaks down geographically.
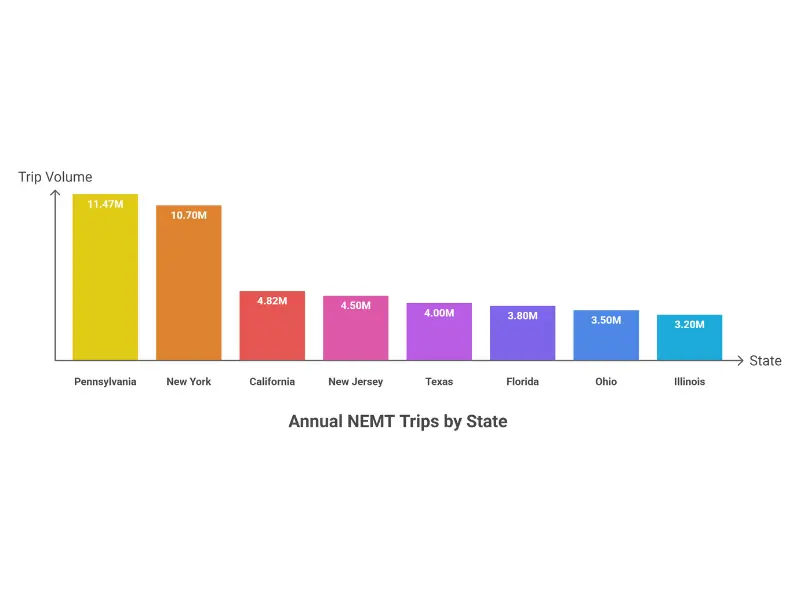
States with Highest NEMT Trip Volume
| Rank | State | Annual NEMT Trips | Population | Trips per 1,000 |
|---|---|---|---|---|
| 1 | Pennsylvania | 11.47 Million | 12.8 Million | 896 |
| 2 | New York | 10.70 Million | 19.7 Million | 543 |
| 3 | California | 4.82 Million | 38.4 Million | 125 |
| 4 | New Jersey | 4.50 Million | 8.9 Million | 506 |
| 5 | Texas | ~4 Million (est.) | 30.5 Million | 131 |
| 6 | Florida | ~3.8 Million (est.) | 22.6 Million | 168 |
| 7 | Ohio | ~3.5 Million (est.) | 11.8 Million | 297 |
| 8 | Illinois | ~3.2 Million (est.) | 12.5 Million | 256 |
Note the dramatic variation in trips per capita. Pennsylvania’s 896 trips per 1,000 residents dwarfs California’s 125—reflecting differences in Medicaid policy, demographics, and program administration rather than just population size.
State Program Model Distribution
States use different approaches to administer NEMT:
| Model Type | Description | Example States |
|---|---|---|
| Statewide Broker | Single broker manages entire state | Missouri (MTM), Oklahoma (ModivCare) |
| Regional Broker | Multiple brokers by region | Maine (8 districts), Louisiana |
| MCO Integrated | Managed care organizations include NEMT | Various expansion states |
| Fee-for-Service | Direct provider reimbursement | Nevada, Arizona, Vermont |
| Mixed Model | Combination approaches | Multiple states |
The trend is toward statewide broker and MCO-integrated models. States find these approaches easier to manage and monitor than fragmented fee-for-service systems.
Regional Market Share Breakdown
| Region | Estimated Market Share | Key Characteristics |
|---|---|---|
| Northeast | ~28% | Dense urban areas, high utilization |
| Southeast | ~22% | Growing Medicaid expansion states |
| Midwest | ~18% | Rural challenges, diverse needs |
| Southwest | ~15% | Fast population growth |
| West/Pacific | ~17% | Large geographic areas |
Urban vs. Rural NEMT Dynamics
| Factor | Urban Markets | Rural Markets |
|---|---|---|
| Demand Volume | Highest absolute | Lower but growing |
| Provider Competition | High | Limited |
| Average Trip Distance | Shorter (5-15 miles) | Longer (25-100+ miles) |
| Vehicle Utilization | Higher | Lower |
| Technology Adoption | Advanced | Developing |
| Growth Opportunity | Moderate (saturated) | High (underserved) |
Rural markets represent significant untapped potential. The challenge lies in developing viable service models for longer distances with lower population density. Providers who solve this equation tap into markets with less competition and substantial unmet need.
Challenges Facing the NEMT Industry
Despite strong growth prospects, the NEMT industry faces significant headwinds. Understanding these challenges helps providers prepare and adapt.
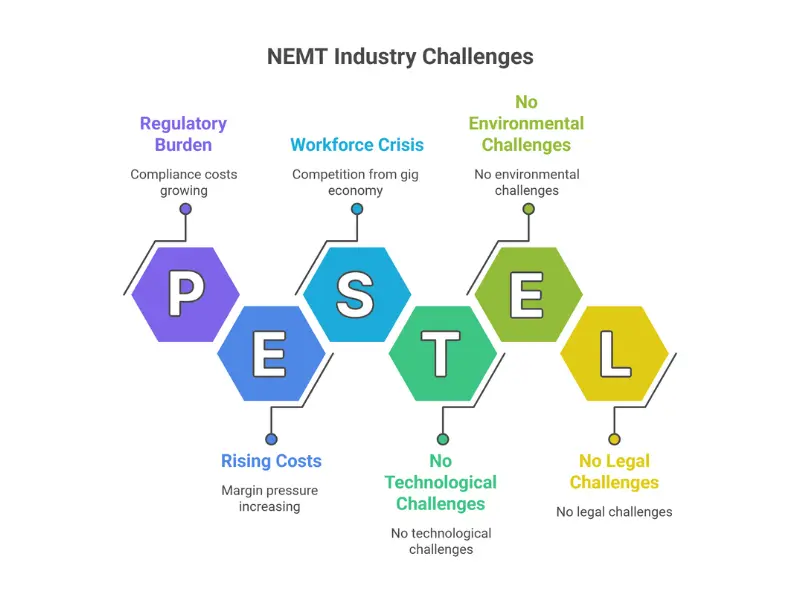
Workforce Crisis: The Driver Shortage
The most pressing challenge isn’t finding patients—it’s finding drivers:
| Workforce Metric | Value |
|---|---|
| Annual Driver Turnover | Exceeds 64% |
| Primary Competition | Parcel delivery, rideshare, gig economy |
| Required Training | Wheelchair securement, HIPAA, CPR, background checks |
| Average Driver Tenure | 8-12 months |
NEMT drivers require more training and certification than rideshare or delivery drivers, yet often earn similar wages. The gig economy’s flexibility appeals to the same worker pool NEMT providers need.
Solutions emerging include:
- Higher wages and benefits
- Flexible scheduling options
- Career advancement pathways
- Improved working conditions
Regulatory Compliance Burden
Compliance costs continue rising:
| Compliance Area | Requirement | Impact |
|---|---|---|
| EVV Implementation | GPS verification systems | Technology investment |
| Prior Authorization | Obtaining approvals before service | Administrative burden |
| Driver Certification | Training and background checks | Ongoing costs |
| Vehicle Inspections | Regular safety certifications | Maintenance overhead |
| HIPAA Compliance | Patient privacy protection | Training and systems |
| Monthly Exclusion Checks | OIG/LEIE screening | Administrative process |
The administrative burden falls disproportionately on smaller providers who lack dedicated compliance staff. Larger operations achieve economies of scale that smaller competitors struggle to match.
For detailed compliance requirements, our NEMT compliance guide covers federal and state obligations.
Reimbursement Challenges
Getting paid remains difficult:
| Challenge | Impact |
|---|---|
| Average Claim Denial Rate | 15-25% |
| Payment Cycle | 30-60+ days |
| Rate Inadequacy | Many states below cost |
| Documentation Requirements | Extensive, time-consuming |
Denial rates of 15-25% mean providers must build appeals processes into their operations. Common denial reasons include missing authorization, eligibility issues, and documentation errors.
Our guide on NEMT denial codes helps providers understand and prevent the most common claim rejections.
Market Fragmentation Issues
The highly fragmented market creates inconsistent service quality:
- No universal quality standards
- Varying technology adoption
- Inconsistent patient experience
- Rural coverage gaps persist
While fragmentation creates opportunities for new entrants, it also means patients often receive unpredictable service quality depending on their location and provider.
Opportunities & Future Outlook
Despite challenges, the NEMT industry presents substantial opportunities for providers positioned to capitalize on market trends.
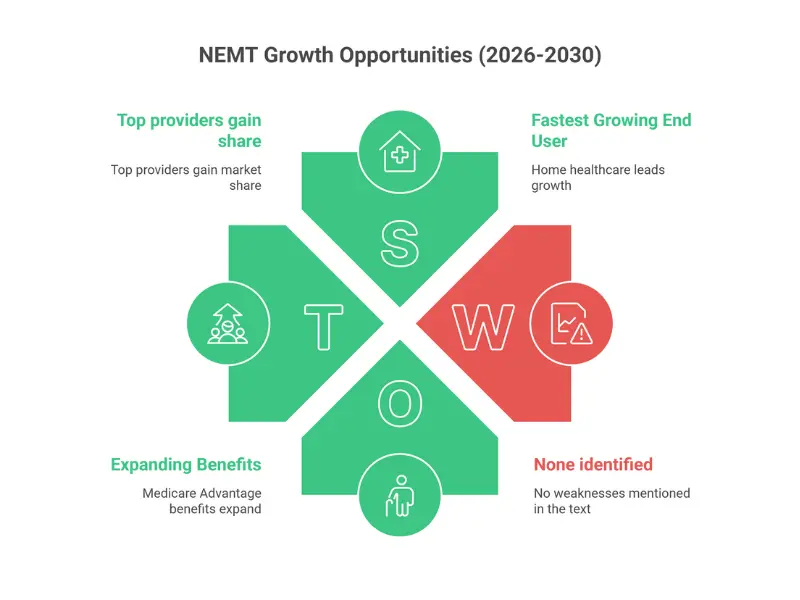
High-Growth Segment Opportunities
| Opportunity | Growth Rate | Key Factors |
|---|---|---|
| Mental Health Transport | 10.11% CAGR | Behavioral health parity, destigmatization |
| Home Healthcare Settings | 10.17% CAGR | Aging in place, hospital-at-home |
| Managed Care Contracts | 10.04% CAGR | State MCO transitions |
| Medicare Advantage | 36%+ plans with NEMT | Growing to 50%+ by 2030 |
| Rural Markets | Underserved | Limited competition, high need |
Medicare Advantage Expansion
The Medicare Advantage NEMT opportunity represents one of the industry’s most promising growth vectors:
| Year | MA Plans Offering NEMT | Trend |
|---|---|---|
| 2020 | ~15% | Baseline |
| 2023 | ~30% | Growing |
| 2025 | 36% | Current |
| 2030 (projected) | 50%+ | Expected |
MA plans increasingly recognize that transportation benefits improve member health outcomes and satisfaction scores—metrics directly tied to plan ratings and reimbursement.
Technology Investment Returns
Technology investments show compelling returns:
| Technology Area | Investment | Typical ROI | Payback Period |
|---|---|---|---|
| Scheduling Software | $200-500/month | 300-500% | 3-6 months |
| Route Optimization | $300-800/month | 200-400% | 4-8 months |
| Billing Automation | $400-1,000/month | 400-600% | 2-5 months |
| Fleet Management | $15-40/vehicle/month | 150-300% | 6-12 months |
Providers who embrace technology gain competitive advantages that compound over time. Those who resist fall increasingly behind.
Five-Year Industry Predictions (2026-2030)
| Trend | Expected Development |
|---|---|
| Market Consolidation | Top 5 providers gain market share |
| Technology Standardization | EVV, GPS, mobile apps become universal |
| Electric Fleet Adoption | 20%+ of fleet by 2030 |
| Medicare Advantage Growth | Becomes second-largest payer after Medicaid |
| Quality-Based Payment | Performance metrics tied to reimbursement |
| Rural Expansion | New service models emerge |
FAQ: NEMT Industry Statistics
How big is the NEMT industry in 2026?
The global NEMT market is valued between $10.76 billion and $16.71 billion in 2024-2025, with projections reaching $18-31 billion by 2031. The US market specifically represents approximately $4.4-6.6 billion, accounting for 41-45% of global revenue. Growth rates range from 7.1% to 9.7% CAGR depending on the source.
What is the NEMT market size in the United States?
The US NEMT market is estimated at $4.4 to $6.6 billion in 2024, with projections reaching $10.25 billion by 2028 and $13.44 billion by 2031. North America dominates the global market with approximately 41-45% share, driven by Medicaid requirements, aging demographics, and rising chronic disease prevalence.
How fast is the NEMT industry growing?
The NEMT industry is growing at a compound annual growth rate (CAGR) of 7.1% to 9.7%, depending on the research source. This outpaces the broader healthcare services industry’s 5-6% growth rate. The fastest-growing segments include mental health transportation (10.11% CAGR) and home healthcare settings (10.17% CAGR).
Is NEMT business profitable?
Yes, NEMT businesses can be profitable with proper management. Profit margins typically range from 15-30% depending on service type, with wheelchair transport averaging 18-28% and stretcher transport achieving 20-30%. Profitability depends heavily on trip volume, operational efficiency, and payer mix. Solo operators can earn $40,000-70,000 annually, while larger operations generate owner income of $200,000 or more.
What is the profit margin for NEMT?
NEMT profit margins vary by service type: ambulatory sedan transport yields 15-25%, wheelchair van transport 18-28%, stretcher transport 20-30%, and bariatric transport 22-32%. Efficient operations with strong volume can achieve the higher end of these ranges, while new or poorly managed operations may see lower margins.
How much do NEMT owners make?
NEMT business owner income ranges from $40,000-70,000 annually for solo operators with one vehicle to $200,000+ for operators with 16+ vehicles. A typical medium-sized operation (6-15 vehicles) generates $100,000-250,000 in owner income. Actual earnings depend on market, service type, operational efficiency, and whether the owner actively operates or manages passively.
Who are the largest NEMT providers?
ModivCare (formerly LogistiCare) is the largest NEMT broker with approximately 25% broker market share, coordinating 64 million rides annually for 24 million members across 30+ states. MTM Inc. is the largest privately-held broker, now covering all 50 states following their October 2024 acquisition of Access2Care. Lyft Healthcare holds approximately 15% market share in the ride-hailing NEMT segment.
Is the NEMT industry consolidated or fragmented?
The NEMT market remains highly fragmented, with no single company controlling more than 5% of the total market. While large brokers like ModivCare dominate trip coordination, thousands of independent providers deliver actual services. This fragmentation creates opportunities for both consolidation plays and new market entrants with differentiated offerings.
How many Americans miss healthcare due to transportation?
According to the American Hospital Association, 3.6 million Americans miss or forego medical care annually due to transportation barriers. UC Davis Health research indicates an additional 5.8 million delay necessary care because of transportation issues. The Robert Wood Johnson Foundation found that 21% of adults without reliable vehicle access skip medical appointments.
What is the cost of missed medical appointments?
Missed appointments cost the US healthcare system approximately $150 billion annually, according to the Medical Transportation Access Coalition. Each no-show costs healthcare providers an average of $200 in lost revenue. No-show rates range from 5% to 30% depending on the healthcare setting, with transportation barriers being a leading cause.
What is the ROI of NEMT investment?
Research from Florida State University found that every $1 spent on NEMT services generates $11 in healthcare savings through reduced emergency room visits, improved chronic disease management, and better medication adherence. Transportation assistance can reduce no-show rates by up to 70%, making it one of healthcare’s most cost-effective interventions.
How much does Medicaid spend on NEMT?
Combined federal and state Medicaid NEMT spending exceeds $3 billion annually, representing less than 1% of total Medicaid expenditures. Approximately 3-4 million Medicaid beneficiaries (4-5% of total enrollment) use NEMT services each year. Medicaid accounts for approximately 52% of all NEMT payments, making it the industry’s dominant payer.
What percentage of Medicare Advantage plans cover NEMT?
As of 2025, approximately 36% of Medicare Advantage plans include NEMT benefits, up from roughly 15% in 2020. This percentage is expected to exceed 50% by 2030 as plans recognize transportation’s impact on member health outcomes and satisfaction scores. MA NEMT benefits typically cover 24-60 trips annually.
What is the fastest-growing NEMT segment?
Mental health transportation is the fastest-growing application segment with a projected CAGR of 10.11% through 2030. This growth reflects increased behavioral health service utilization, parity requirements, and reduced stigma around mental health treatment. Home healthcare settings represent the fastest-growing end-user segment at 10.17% CAGR.
What are the main NEMT industry challenges?
The primary challenges facing the NEMT industry include: driver shortages with turnover exceeding 64% annually, increasing regulatory compliance burden, reimbursement rate inadequacy in many states, market fragmentation affecting service consistency, and competition from ride-hailing companies for ambulatory trips. Rising operational costs, particularly fuel and insurance, further pressure margins.
What is the NEMT industry?
The NEMT industry, or Non-Emergency Medical Transportation industry, provides transportation services to patients who need to travel to medical appointments but do not require emergency ambulance services. NEMT serves patients traveling to dialysis, chemotherapy, physical therapy, mental health appointments, routine doctor visits, and other healthcare services. The industry is primarily funded through Medicaid, Medicare Advantage, and private insurance, with the global market valued at approximately $10-17 billion in 2024-2025.
How many NEMT trips are provided annually in the United States?
Approximately 200 million NEMT trips are provided annually in the United States. Pennsylvania leads the nation with 11.47 million annual trips, followed by New York with 10.70 million trips. Medicaid beneficiaries alone account for 60+ million ride-days annually, with 3-4 million beneficiaries (4-5% of total Medicaid enrollment) using NEMT services each year.
What is the average cost of an NEMT trip?
NEMT trip costs vary by service type and location. Ambulatory sedan trips typically cost $25-45, wheelchair van transport ranges from $50-80, stretcher transport costs $100-200, and bariatric transport can exceed $150-250 per trip. Long-distance medical transport may cost $200-500 or more. Medicaid reimbursement rates vary significantly by state, with some states paying as low as $15-20 per trip while others reimburse $50+ for basic services.
Why is NEMT important for healthcare?
NEMT is critical for healthcare because transportation barriers cause 3.6 million Americans to miss medical care annually, costing the healthcare system $150 billion in missed appointments, delayed treatments, and preventable emergency visits. Research shows that every $1 invested in NEMT generates $11 in healthcare savings through reduced ER visits, improved chronic disease management, and better medication adherence. NEMT enables patients to access preventive care, manage chronic conditions, and avoid costly emergency interventions.
What types of vehicles are used in NEMT?
NEMT services utilize several vehicle types based on patient needs. Wheelchair-accessible vans represent the largest segment at 43.71% of the market and include vehicles equipped with ramps or lifts for wheelchair transport. Ambulatory sedans serve patients who can walk but need transportation assistance. Stretcher vehicles transport patients who must remain lying down. Bariatric vehicles accommodate larger patients with specialized equipment. Hybrid and electric vehicles represent the fastest-growing segment at 9.98% CAGR as the industry pursues sustainability.
How do patients book NEMT services?
Patients can book NEMT services through several channels. Medicaid beneficiaries typically call their state’s NEMT broker (such as ModivCare, MTM, or a regional provider) to schedule rides. Healthcare facilities often coordinate transportation through social workers or discharge planners. Standing orders allow recurring trips (like dialysis three times weekly) to be scheduled automatically. Mobile apps and online portals from providers like Uber Health and Lyft Healthcare enable on-demand booking. Most bookings require 48-72 hours advance notice, though same-day service is sometimes available for urgent needs.
For step-by-step booking instructions, see our guide on how to book NEMT services.
What is the difference between NEMT and ambulance services?
NEMT and ambulance services serve different patient needs and operate under different regulations. Ambulances provide emergency medical transport for life-threatening conditions, staffed by EMTs or paramedics with medical equipment for treatment during transport. NEMT provides non-emergency transport for patients who need help getting to scheduled medical appointments but don’t require medical intervention during the trip. NEMT vehicles include sedans, wheelchair vans, and stretcher vehicles, while ambulances are specialized emergency response vehicles. NEMT is typically covered by Medicaid and Medicare Advantage, while ambulance services are covered as emergency medical care.
What qualifications do NEMT drivers need?
NEMT driver requirements vary by state but typically include: a valid driver’s license (often commercial CDL for larger vehicles), minimum age of 21 years, clean driving record with 3-year MVR check, FBI background check and OIG/LEIE exclusion screening, drug testing (5-panel minimum), CPR/First Aid certification, HIPAA training for patient privacy, and wheelchair securement training for applicable vehicles. Many states require 8-16 hours of NEMT-specific training covering patient assistance, safety procedures, and customer service.
How does Medicaid cover NEMT?
Medicaid has required NEMT coverage since 1965 as a federally mandated benefit. States must ensure Medicaid beneficiaries have transportation to covered medical services, though states have flexibility in how they administer the benefit. Most states use transportation brokers (like ModivCare or MTM) or managed care organizations to coordinate NEMT services. Beneficiaries typically call a central number to schedule rides to covered medical appointments. Medicaid NEMT spending exceeds $3 billion annually, representing less than 1% of total Medicaid expenditure but enabling billions more in healthcare utilization.
Does Medicare cover NEMT?
Original Medicare (Parts A and B) does not cover routine NEMT. Medicare only covers ambulance transportation when medically necessary and the patient is bed-confined. However, Medicare Advantage plans (Part C) can and increasingly do offer NEMT as a supplemental benefit. As of 2025, approximately 36% of Medicare Advantage plans include NEMT benefits, typically covering 24-60 trips annually. This percentage is expected to exceed 50% by 2030. Beneficiaries seeking NEMT coverage should consider Medicare Advantage plans with transportation benefits.
Learn more about Medicare Advantage NEMT benefits in our detailed coverage guide.
What are NEMT brokers?
NEMT brokers are companies that coordinate non-emergency medical transportation on behalf of state Medicaid agencies, managed care organizations, or health plans. Brokers like ModivCare, MTM, and regional companies manage networks of transportation providers, handle trip scheduling, verify patient eligibility, process authorizations, and manage billing. They serve as intermediaries between patients needing rides, transportation providers with vehicles and drivers, and payers funding the services. The broker model allows states to centralize NEMT administration while leveraging competition among local providers.
For providers working with brokers, our NEMT broker billing guide explains the relationship and payment processes.
What is the outlook for NEMT industry jobs?
The NEMT industry offers growing employment opportunities despite workforce challenges. Driver positions remain in high demand due to industry growth and turnover exceeding 64% annually. Dispatch and scheduling roles are expanding with increasing trip volumes. Administrative positions in billing, compliance, and customer service are growing. Technology roles are emerging as companies adopt software solutions. The Bureau of Labor Statistics projects healthcare support occupations to grow faster than average through 2030, with transportation roles supporting this growth. Entry-level positions are available for drivers meeting basic qualifications, while experienced professionals can advance to management roles.
Methodology & Data Sources
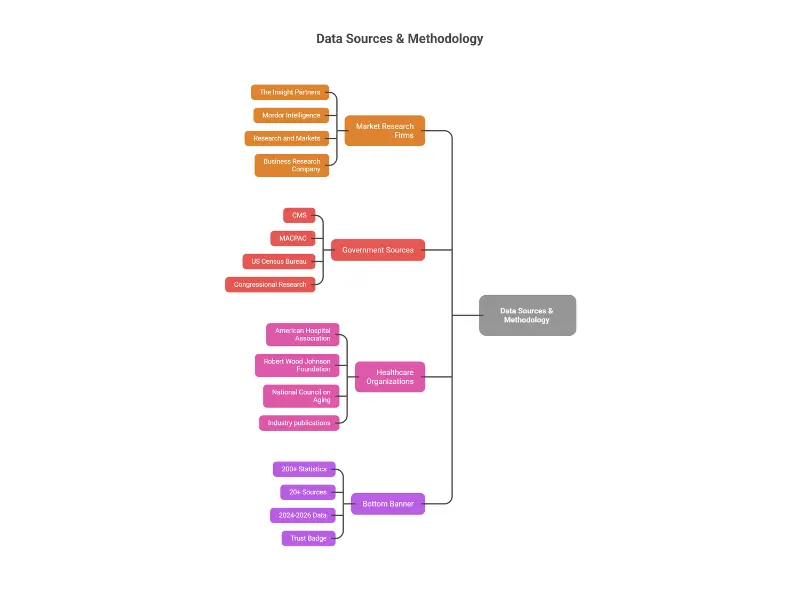
Research Sources
This comprehensive NEMT industry statistics report synthesizes data from multiple authoritative sources:
Market Research Firms:
- The Insight Partners
- Mordor Intelligence
- Research and Markets
- Business Research Company
- 360iResearch
- Market Research Future
- KD Market Insights
- Business Research Insights
Government & Official Sources:
- Centers for Medicare & Medicaid Services (CMS)
- Medicaid and CHIP Payment and Access Commission (MACPAC)
- US Census Bureau
- Congressional Research Service
Healthcare Organizations:
- American Hospital Association
- Robert Wood Johnson Foundation
- UC Davis Health
- Commonwealth Fund
- National Council on Aging
Industry Sources:
- Company press releases and annual reports
- Medical Transportation Access Coalition (MTAC)
- Industry trade publications
Data Validation Process
Where sources provided conflicting figures, we:
- Prioritized government and official sources for regulatory data
- Used ranges when market research firms disagreed significantly
- Noted methodology differences affecting valuations
- Selected most recent data when multiple years available
Data Limitations
Readers should note:
- Market size estimates vary based on methodology and scope
- State-level NEMT spending is not uniformly reported
- Private pay market data is less transparent than Medicaid data
- Projections represent estimates based on current trends
Update Schedule
This report will be updated:
- Quarterly for market size figures
- Semi-annually for company market share
- As needed for regulatory changes
- Annually for comprehensive refresh
Conclusion: Key Takeaways for 2026
The NEMT industry statistics paint a picture of a sector at an inflection point. Here’s what the data tells us:
1. The Market is Substantial and Growing With global valuations between $10-17 billion and projected growth to $18-31 billion by 2031, NEMT represents a significant healthcare services opportunity.
2. Demographics Guarantee Demand Growth The aging population (58 million Americans 65+ today, growing to 88.8 million by 2060) combined with rising chronic disease prevalence ensures sustained demand increase for decades.
3. Fragmentation Creates Opportunity No single company controls more than 5% of the total market. For providers with superior service, technology, or geographic focus, room exists to capture market share.
4. Technology is the Differentiator Providers embracing technology see 25-45% improvements across key metrics. Those resisting digital transformation will struggle to compete.
5. Healthcare Systems Recognize Value The $11 return for every $1 invested in NEMT has caught healthcare administrators’ attention. Expect continued integration of transportation into care delivery models.
What This Means for You
If you’re an NEMT provider: Focus on technology adoption, operational efficiency, and positioning in high-growth segments like mental health and home healthcare transport. Consider professional billing services to maximize revenue collection.
If you’re starting an NEMT business: The market fundamentals support new entrants, but success requires solid business planning, compliance understanding, and technology investment. Start with our guide on how to start NEMT billing.
If you’re a healthcare administrator: Transportation barriers cost your organization money through no-shows and poor outcomes. Partnering with quality NEMT providers or investing in member transportation benefits generates measurable ROI.
If you’re an investor: The combination of demographic tailwinds, fragmented market structure, and technology transformation creates both growth and consolidation opportunities.
The NEMT industry statistics for 2026 confirm what industry insiders have known: this sector isn’t just growing—it’s becoming essential infrastructure for healthcare delivery. Those who position themselves effectively will capture substantial value as this market matures.
For personalized guidance on NEMT billing, compliance, or business development, Elite Med Financials provides comprehensive support for NEMT providers nationwide.
Related Resources: